鸢尾花数据集分类-随机森林这个比较简单理解,是比较基础点的。现在直接对数据集的特征进行遍历,并分析过拟合情况。
https://blog.csdn.net/weixin_42567027/article/details/107488666
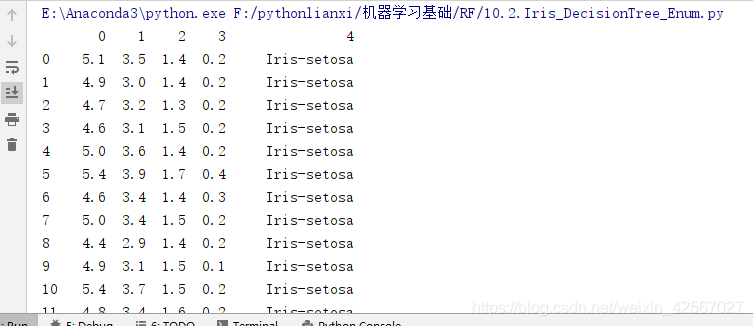
数据集
代码
// An highlighted block
import numpy as np
import pandas as pd
import matplotlib.pyplot as plt
import matplotlib as mpl
from sklearn.ensemble import RandomForestClassifier
def iris_type(s):
it = {
'Iris-setosa': 0, 'Iris-versicolor': 1, 'Iris-virginica': 2}
return it[s]
# 'sepal length', 'sepal width', 'petal length', 'petal width'
iris_feature = u'花萼长度', u'花萼宽度', u'花瓣长度', u'花瓣宽度'
if __name__ == "__main__":
mpl.rcParams['font.sans-serif'] = [u'SimHei'] # 黑体 FangSong/KaiTi
mpl.rcParams['axes.unicode_minus'] = False
data = pd.read_csv('F:\pythonlianxi\shuju\iris.data', header=None)
x_prime = data[range(4)]
y = pd.Categorical(data[4]).codes
feature_pairs = [[0, 1], [0, 2], [0, 3], [1, 2], [1, 3], [2, 3]]
plt.figure(figsize=(16, 9), facecolor='#FFFFFF')
for i, pair in enumerate(feature_pairs):
# 准备数据
x = x_prime[pair]
# 随机森林 200课决策树,深度为3
clf = RandomForestClassifier(n_estimators=200, criterion='entropy', max_depth=3)
clf.fit(x, y.ravel())
# 画图
N, M = 50, 50 # 横纵各采样多少个值
x1_min, x2_min = x.min()
x1_max, x2_max = x.max()
t1 = np.linspace(x1_min, x1_max, N)
t2 = np.linspace(x2_min, x2_max, M)
x1, x2 = np.meshgrid(t1, t2) # 生成网格采样点
x_test = np.stack((x1.flat, x2.flat), axis=1) # 测试点
# 训练集上的预测结果
y_hat = clf.predict(x)
y = y.reshape(-1)
c = np.count_nonzero(y_hat == y) # 统计预测正确的个数
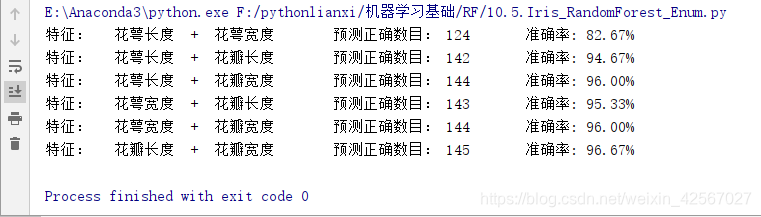
print ('特征: ', iris_feature[pair[0]], ' + ', iris_feature[pair[1]],end='\t')
print ('\t预测正确数目:', c,end='\t')
print ('\t准确率: %.2f%%' % (100 * float(c) / float(len(y))))
# 显示
cm_light = mpl.colors.ListedColormap(['#A0FFA0', '#FFA0A0', '#A0A0FF'])
cm_dark = mpl.colors.ListedColormap(['g', 'r', 'b'])
y_hat = clf.predict(x_test) # 预测值
y_hat = y_hat.reshape(x1.shape) # 使之与输入的形状相同
plt.subplot(2, 3, i+1)
plt.pcolormesh(x1, x2, y_hat, cmap=cm_light) # 预测值
plt.scatter(x[pair[0]], x[pair[1]], c=y, edgecolors='k', cmap=cm_dark) # 样本
plt.xlabel(iris_feature[pair[0]], fontsize=18)
plt.ylabel(iris_feature[pair[1]], fontsize=18)
plt.xlim(x1_min, x1_max)
plt.ylim(x2_min, x2_max)
plt.grid()
plt.tight_layout(2.5)
plt.subplots_adjust(top=0.92)
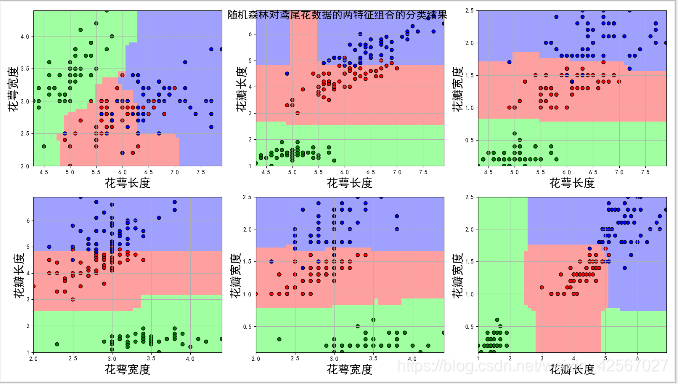
plt.suptitle(u'随机森林对鸢尾花数据的两特征组合的分类结果', fontsize=18)
plt.show()
实验分析
两两特征进行组合,最后的鸢尾花分类效果不用,也说明有些特征的区分效果并不好,因此可以对特征进行选择,得到最好的识别效果。
过拟合分析
从之前的研究中发现决策树的深度不同,识别率也会不同。虽然合适的深度会得到很好的识别效果,但是也会造成过拟合现象,使得算法的鲁棒性不强。
随机森林算法在随机决策树生成过程采用的Boostrap,所以在一棵树的生成过程并不会使用所有的样本,未使用的样本就叫(Out_of_bag)袋外样本(oob 数据集),通过袋外样本,可以评估这个树的准确度,其他子树叶按这个原理评估,最后可以取平均值。
oob_score = True:表示使用 oob 数据集作为验证数据集,估算算法的泛化能力;
oob_score 默认为 False,不使用 oob 数据集作为验证数据集。
修改代码,分析过拟合现象。
// An highlighted block
clf = RandomForestClassifier(n_estimators=200, criterion='entropy', max_depth=3, oob_score=True)
clf.fit(x, y.ravel())
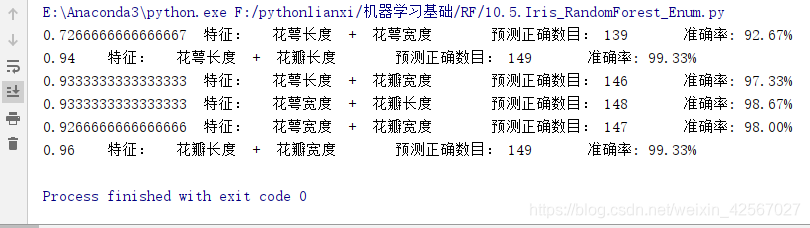
print(clf.oob_score_,end='\t')
当max_depth=3时没有出现明显的过拟合。
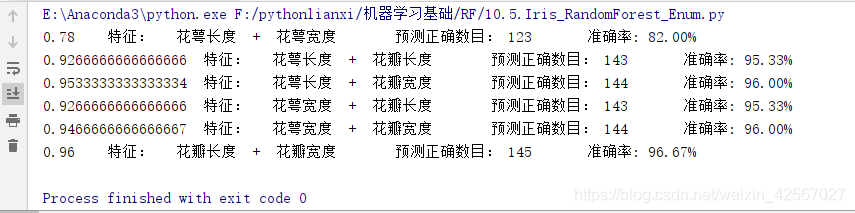
当max_depth=5时,特征:花萼长度+花萼宽度,出现了过拟合现象。
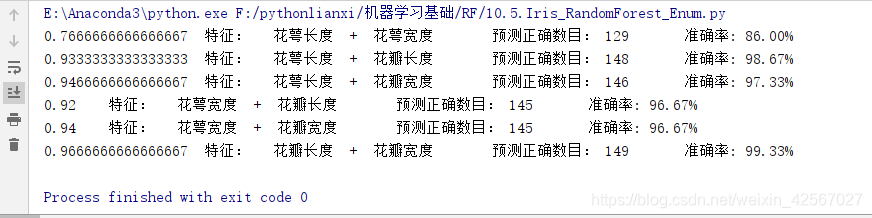
当max_depth=10时,特征:花萼长度+花萼宽度,发生了严重的过拟合。