前置知识
–前置知识
Numpy:Python的一个科学计算包
matplotlib:Python2d绘图库
高等数学,线性代数,统计学
Numpy
# numpy
import numpy as np
np.__version__ # 查看numpy版本
创建一个numpy
// An highlighted block
var foo = 'bar';
narray = np.array([i for i in range(10)])
判断一个对象类型
type(narray)
narray.dtype
# 第三种创建numpy
x = np.arange(10)
x # 一维数组向量
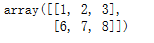
# 二维数组矩阵 # 值为-1时,不用关心第二个参数是什么
x = x.reshape(2,5)
x.ndim #维度
x.size # 元素个数
x.shape # 矩阵形状
ndarray 数据访问
x[-1]

x[-1][0]

# x[行切片:列切片]
x[0:,1:4]
矩阵运算
x+1 #矩阵中每个数都加一
np.sin(x)
matplotlib
# 导入库
from  matplotlib import pyplot as plt
import numpy as np
# 构造数据
x = [i for i in range (0,17,4)]
y=x
plt.plot(x,y)
plt.show()

绘制散点图
# 均值为0 方差为1 正态分布数据
x = np.random.normal(0,1,1000000)
y = np.random.normal(0,1,1000000)
plt.scatter(x,y,alpha= 0.1) #
plt.show()

将sklearn数据可视化
#导入sklean
from sklearn import datasets
# 加载数据
iris = datasets.load_iris()
iris.keys()

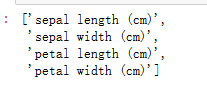
iris.feature_names
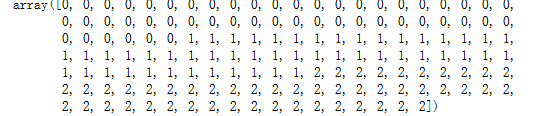
iris.target
扫描二维码关注公众号,回复:
11438836 查看本文章

iris.target_names

iris.data.shape
X= iris.data[:,0:2]
Y= iris.target
plt.scatter(X[:,0],X[:,1])

bool索引
X[Y==0][:,0]#萼片维度huizhi
plt.scatter(X[Y==0][:,0],X[Y==0][:,1],color='r')
plt.scatter(X[Y==1][:,0],X[Y==1][:,1],color='b')
plt.scatter(X[Y==2][:,0],X[Y==2][:,1],color='g')
plt.show()

X=iris.data[:,2:]# 花瓣维度绘制
plt.scatter(X[Y==0][:,0],X[Y==0][:,1],color='r',marker="+")
plt.scatter(X[Y==1][:,0],X[Y==1][:,1],color='b',marker="o")
plt.scatter(X[Y==2][:,0],X[Y==2][:,1],color='g',marker="x")
plt.show()
