搭建prometheus+grafana监控SpringBoot应用入门
1. springBoot 应用准备
pom.xml依赖
      <dependency>
            <groupId>org.springframework.boot</groupId>
            <artifactId>spring-boot-starter-actuator</artifactId>
        </dependency>
        <!--prometheus-->
        <dependency>
            <groupId>io.micrometer</groupId>
            <artifactId>micrometer-registry-prometheus</artifactId>
            <version>1.0.3</version>
        </dependency>
并且主动向prometheus 上报application名.
   /**
     * 上报application 到 Prometheus
     */
    @Bean
    MeterRegistryCustomizer<MeterRegistry> metricsCommonTags() {
        return registry -> registry.config().commonTags("application", "yourappName");
    }
SpringBoot actuator端开启 (自行调整,我这里全部开启):
management:
  endpoints:
    web:
      exposure:
        include: '*'
  endpoint:
    health:
      show-details: always
    prometheus:
      enabled: true
最好启动一下查看端点暴露的情况,尤其检查 /actuator/prometheus 是否成功暴露

2. 下载并安装prometheus
最新下载地址 : https://prometheus.io/download/
配置prometheus.yml(安装完成后的目录下面有)

重点是配置好基础的job_name,metrics_path,还有应用的ip和端口号,例如 :
scrape_configs:
  - job_name: 'prometheus'
    static_configs:
    - targets: ['localhost:9090']

  - job_name: 'test-application'
    metrics_path: '/actuator/prometheus'
    static_configs:
    - targets: ['localhost:9527']
配置好之后,可以启动prometheus,并且访问prometheus,默认访问地址 http://localhost:9090
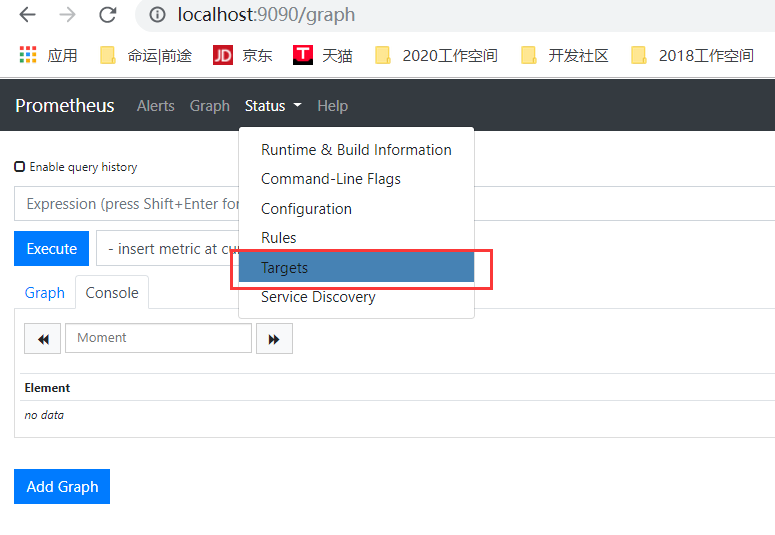
此时可以看到prometheus的情况,点击Status的targets,查看应用实例情况

3. 下载并安装grafana(windows的安装过程中最好关闭杀毒软件,可能导致安装失败)
最新下载地址 : https://grafana.com/grafana/download
运行启动grafana,默认访问地址 : http://localhost:3000, 默认用户名/密码 admin/admin

配置datasource(Configuration里面),选择Prometheus,配置好prometheus,本机运行的prometheus,则access选择Server即可。然后点击Save&Test

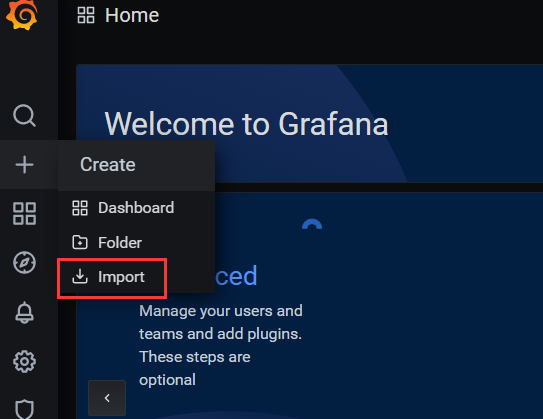
配置Dashboard,可以定制,可以自选(种类繁多,花样不胜枚举),这里直接选造好的SpringBoot的Dashboard导入(拿来即用)
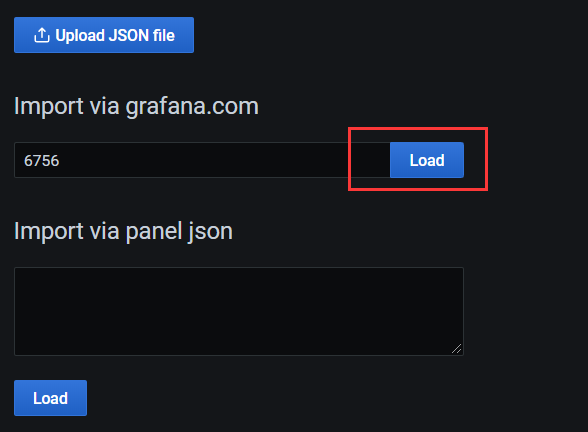
直接地址栏输入
https://grafana.com/grafana/dashboards/6756 或者 6756,然后点击load。
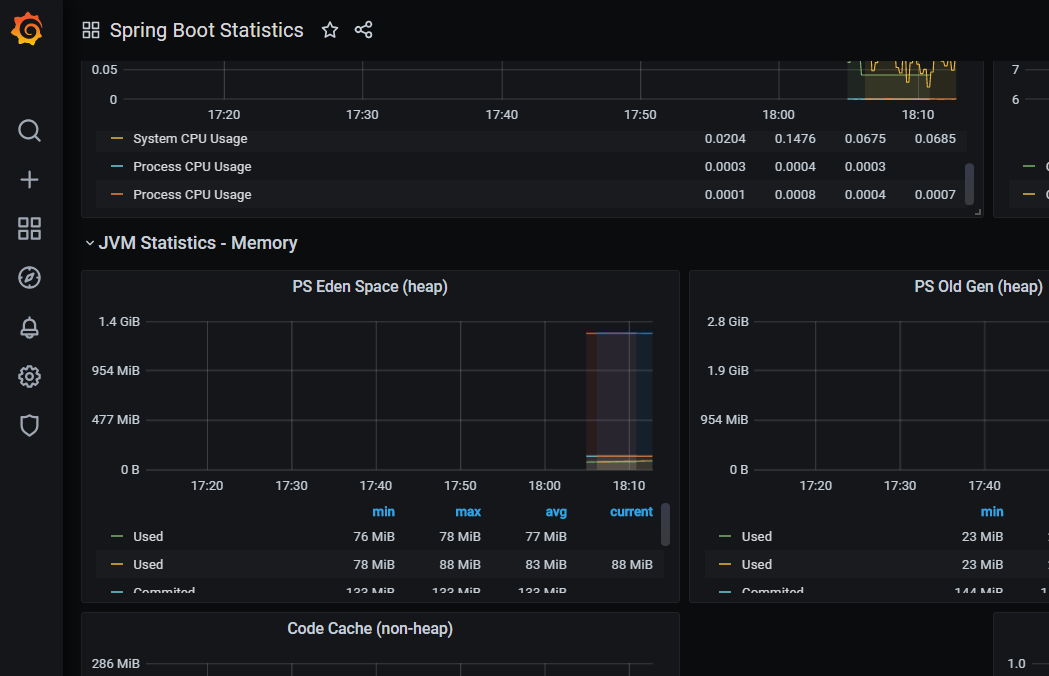
此时点击Dashboard :