版权声明:本文为博主原创文章,未经博主允许不得转载。 https://blog.csdn.net/u010391342/article/details/88970133
概述
Prometheus是一个最初在SoundCloud上构建的开源系统监视和警报工具包 。
添加依赖
    <dependency>
            <groupId>org.springframework.boot</groupId>
            <artifactId>spring-boot-starter-actuator</artifactId>
        </dependency>

        <!--prometheus监控  https://prometheus.io/docs/introduction/overview/-->
        <dependency>
            <groupId>io.micrometer</groupId>
            <artifactId>micrometer-registry-prometheus</artifactId>
            <version>1.1.3</version>
        </dependency>
配置文件
spring.application.name=SpringBootPrometheus
# 监控端点配置
# 自定义端点路径  将  /actuator/{id}为/manage/{id}
#management.endpoints.web.base-path=/manage
management.endpoints.web.exposure.include=*
management.metrics.tags.application=${spring.application.name}
启动类添加
@SpringBootApplication
public class FreemarkerApplication {
@Value("${spring.application.name}")
private String application;
public static void main(String[] args) {
SpringApplication.run(FreemarkerApplication.class, args);
}
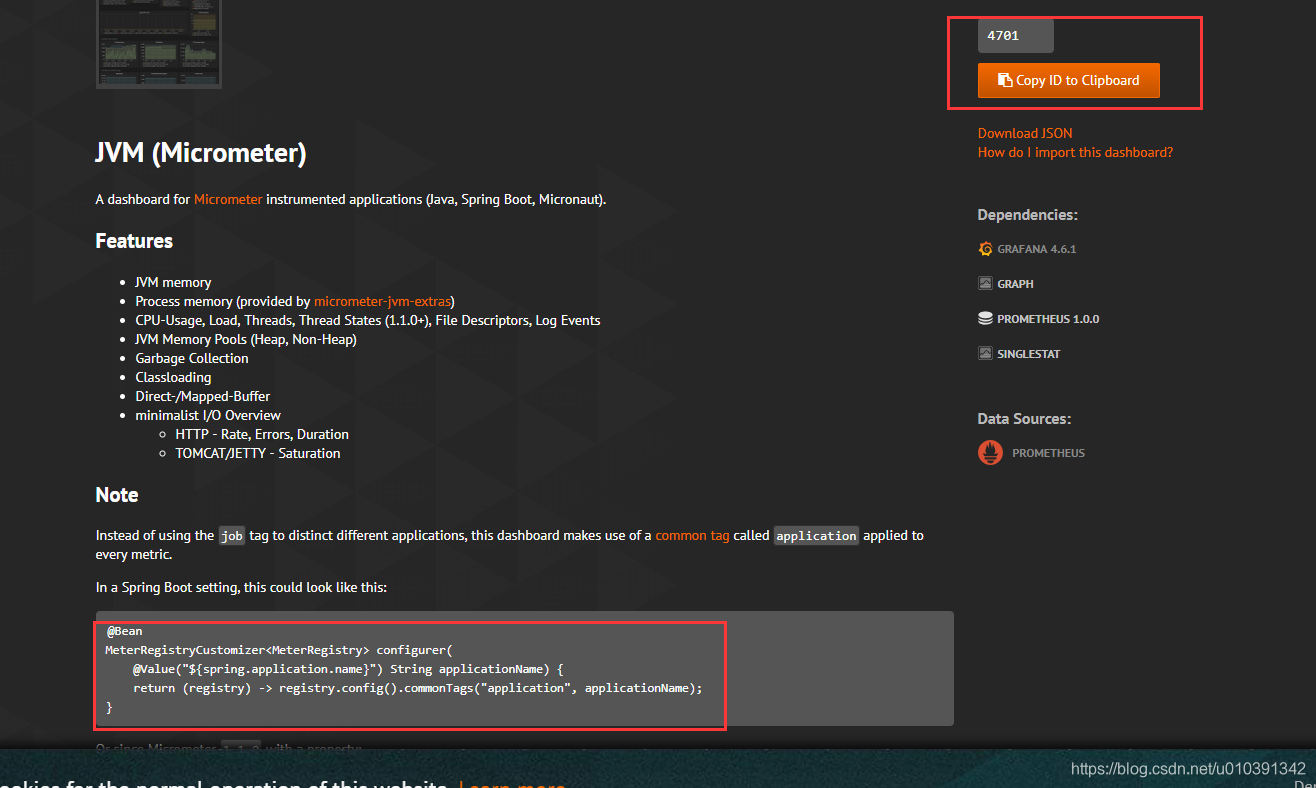
@Bean
MeterRegistryCustomizer<MeterRegistry> configurer() {
return (registry) -> registry.config().commonTags("application", application);
}
}
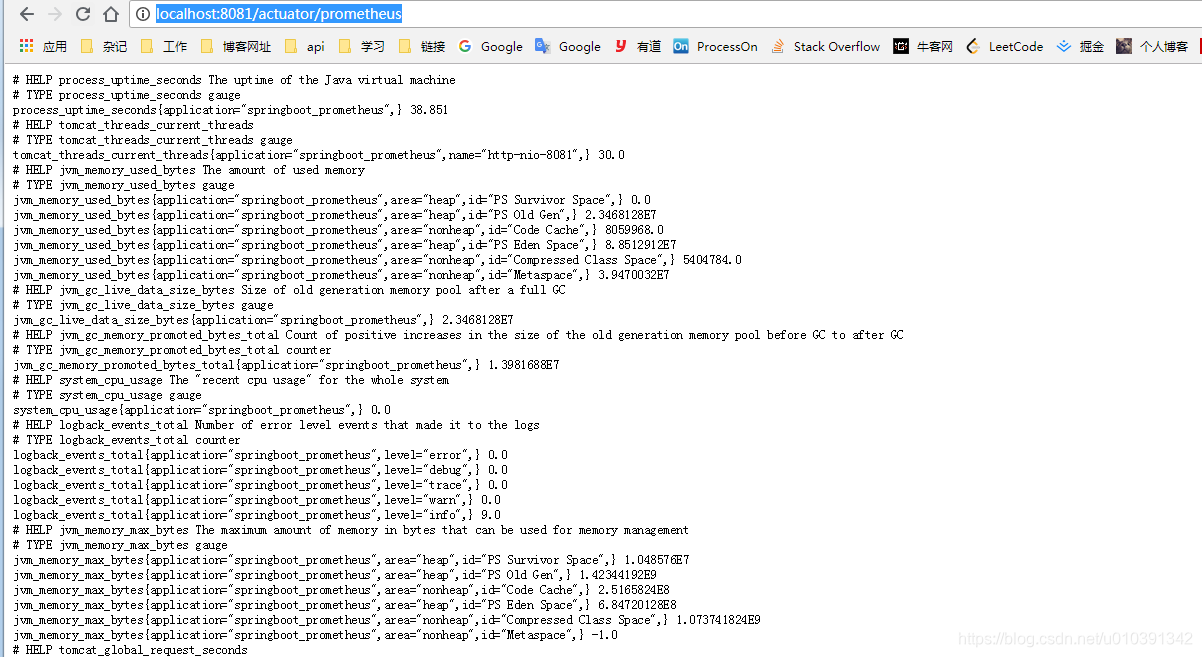
查看度量指标是否集成成功
浏览器访问:http://localhost:8081/actuator/prometheus
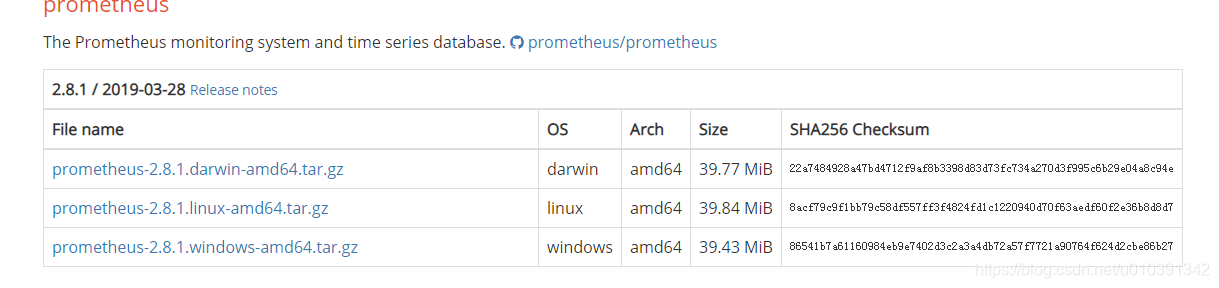
安装Prometheus
- 下载地址:https://prometheus.io/download/
- 选择时间序列数据库版本
Prometheus会将所有采集到的样本数据以时间序列(time-series)的方式保存在内存数据库中,并且定时保存到硬盘上。
- Linux启动方式:
nohup /home/prometheus/prometheus2.8.1/prometheus &
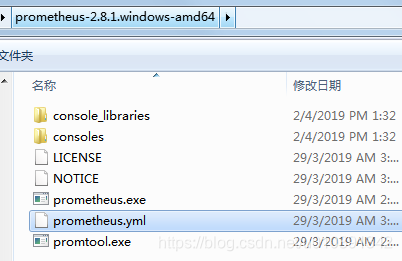
配置prometheus.yml
- SpringBoot官方配置:https://docs.spring.io/spring-boot/docs/2.1.3.RELEASE/reference/htmlsingle/
- prometheus官方文档:https://prometheus.io/docs/introduction/overview/
- Prometheus-配置解析: https://www.cnblogs.com/liujiliang/p/10080849.html
 # 全局配置
global:
  scrape_interval:     15s # 多久 收集 一次数据
  evaluation_interval: 15s # 多久评估一次 规则
  scrape_timeout:      10s   # 每次 收集数据的 超时时间

# Alertmanager configuration
alerting:
  alertmanagers:
  - static_configs:
    - targets:
      # - alertmanager:9093

# # 规则文件, 可以使用通配符
rule_files:
  # - "first_rules.yml"
  # - "second_rules.yml"

scrape_configs:
  - job_name: 'prometheus'
    static_configs:
    - targets: ['localhost:9090']

# SpringBoot应用配置
  - job_name: 'SpringBootPrometheus'
    scrape_interval: 5s
    metrics_path: '/actuator/prometheus'
    static_configs:
      - targets: ['127.0.0.1:8081']
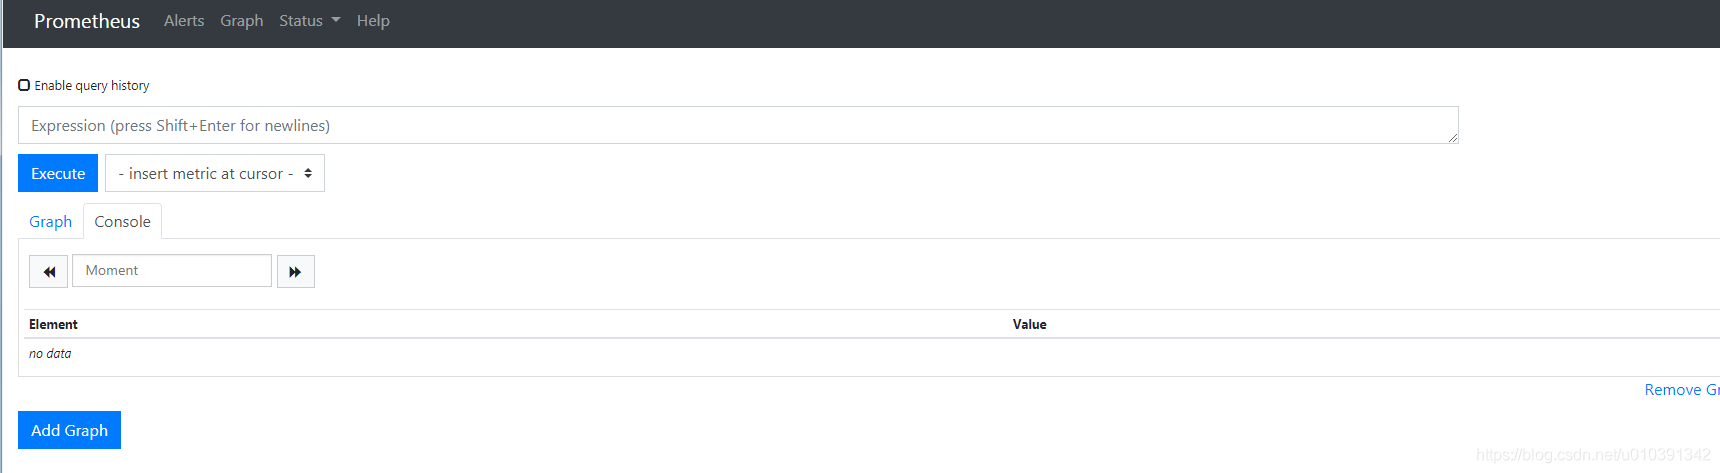
启动Prometheus
浏览器访问:http://localhost:9090
查看Prometheus监控的应用
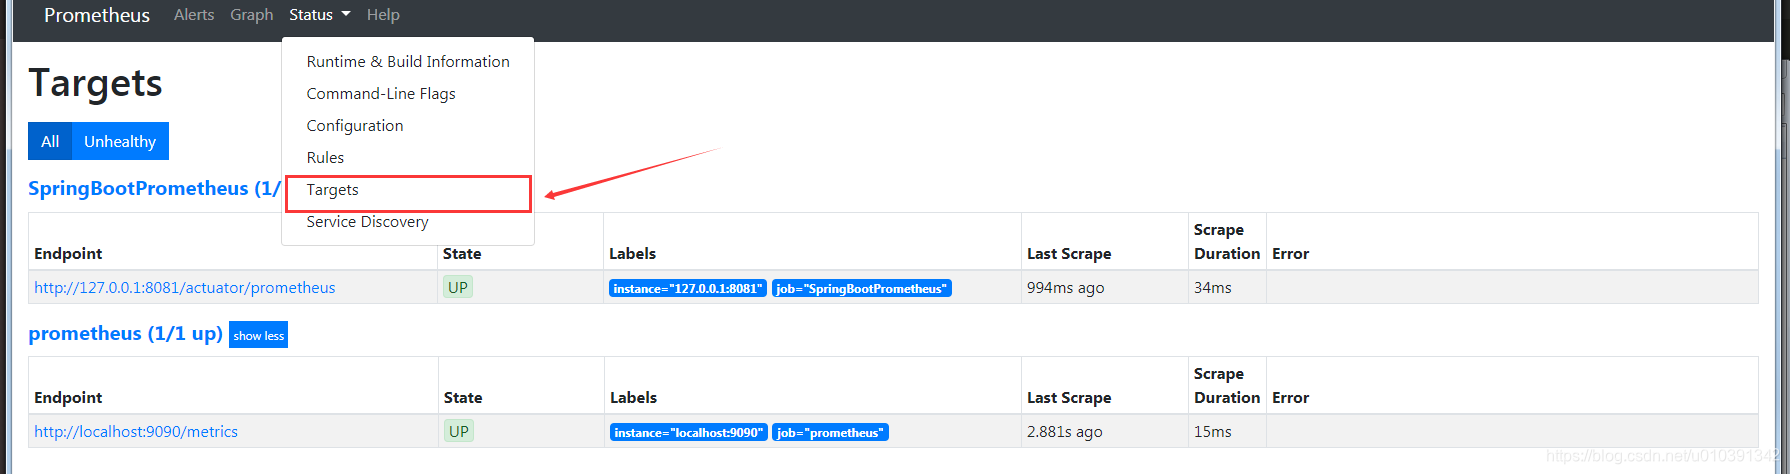
- UP状态表示目前存活的实例
-
查看具体的监控指标

Grafana安装配置
- 下载地址:https://grafana.com/grafana/download
- 这里本机使用win系统:https://dl.grafana.com/oss/release/grafana-6.0.2.windows-amd64.zip
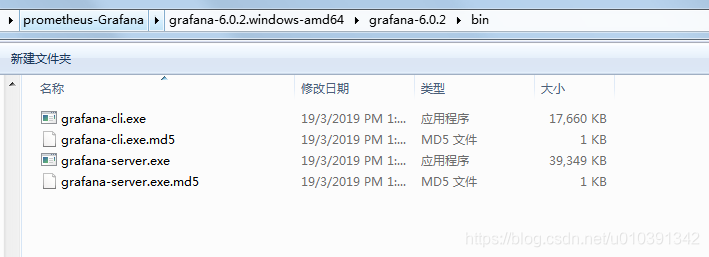
启动
grafana-server.exe
Linux启动方式:nohup /home/prometheus/prometheus2.8.1/prometheus &
浏览器访问:http://127.0.0.1:3000/login

默认用户和密码均为admin
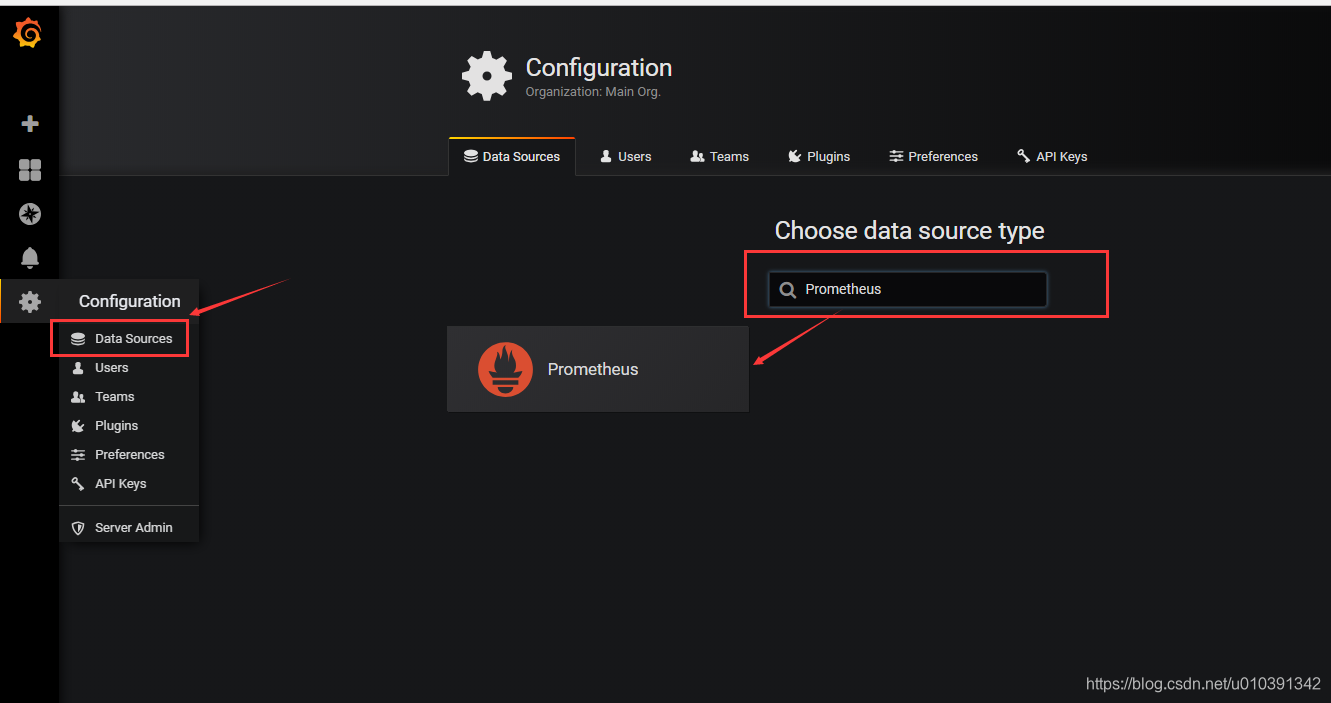
添加数据源
在Data Sources选项中添加数据源
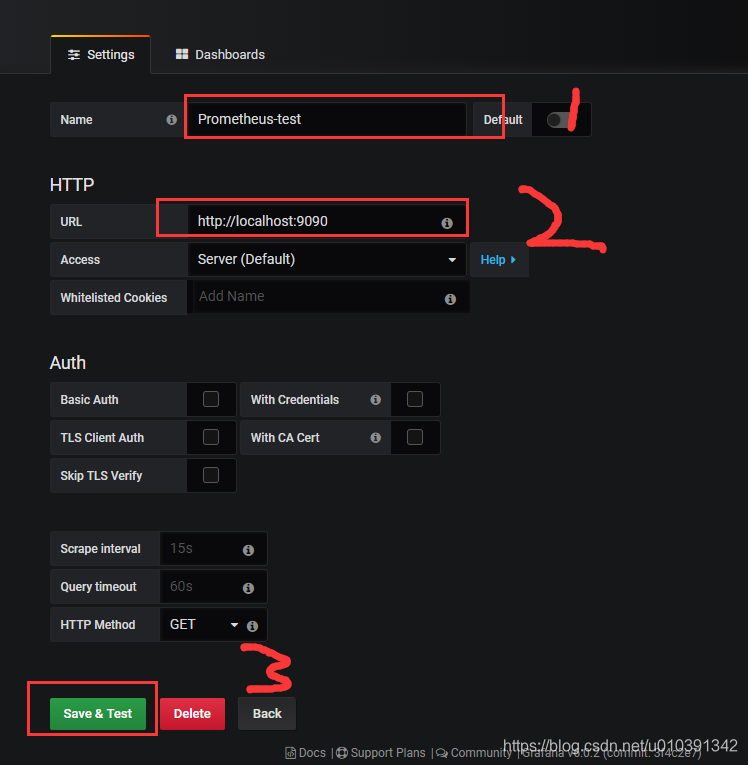
- 设置
数据源的名称(唯一的,可添加多个数据源)和Prometheus的访问地址,如果Prometheus有设置账号密码才可以访问,则需要在Auth模块勾选Basuc Auth设置账号密码
导入仪表盘模板
- 模板地址:https://grafana.com/dashboards
- 在搜索框中搜索
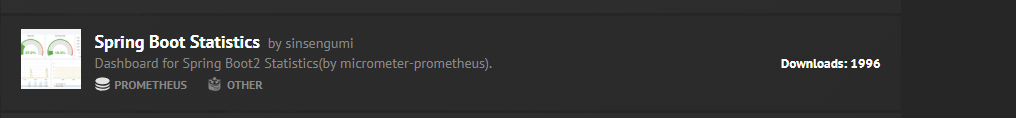
Spring Boot会检索出相关的模板,选择一个自己喜欢
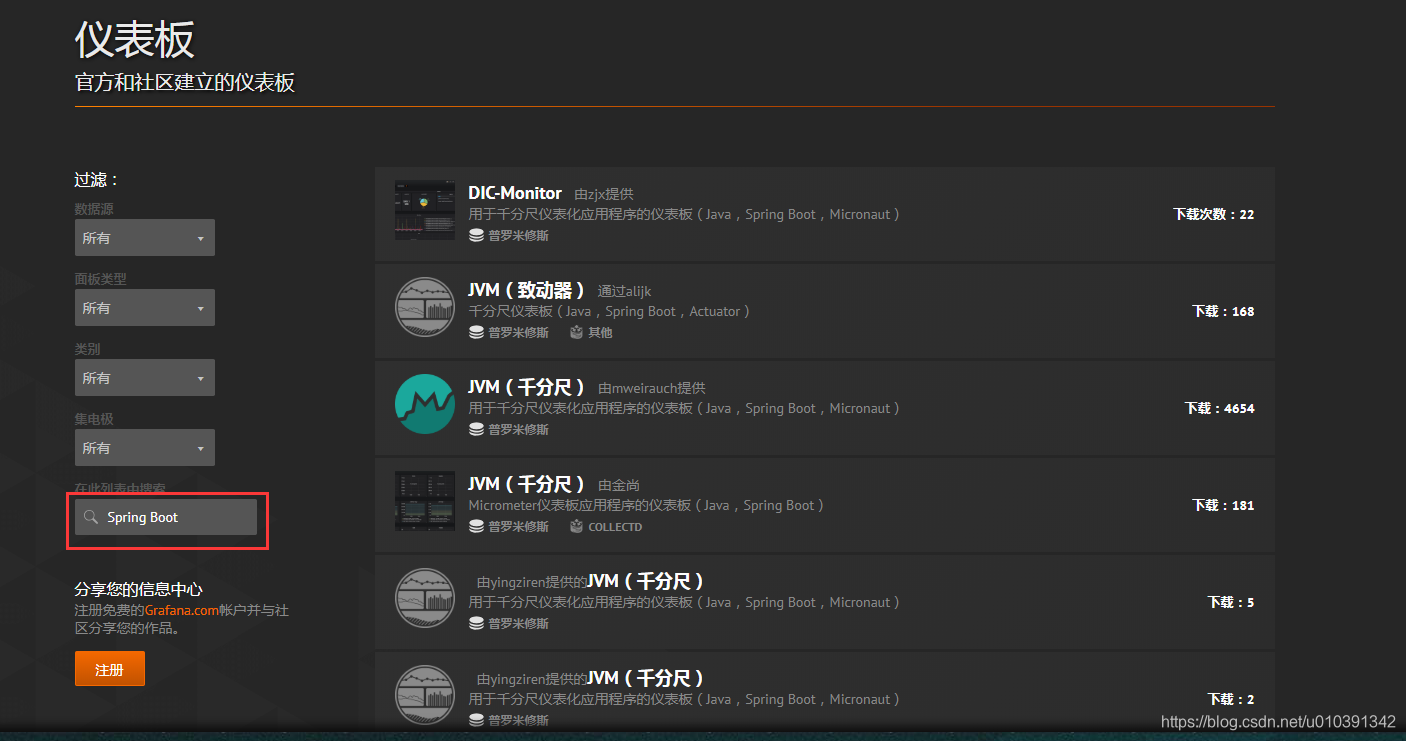
这里我选择我比较喜欢第三个和第五个。模板ID分别是4701,6756

- 红框标注的部分就是项目中需要配置代码, 复制模板ID
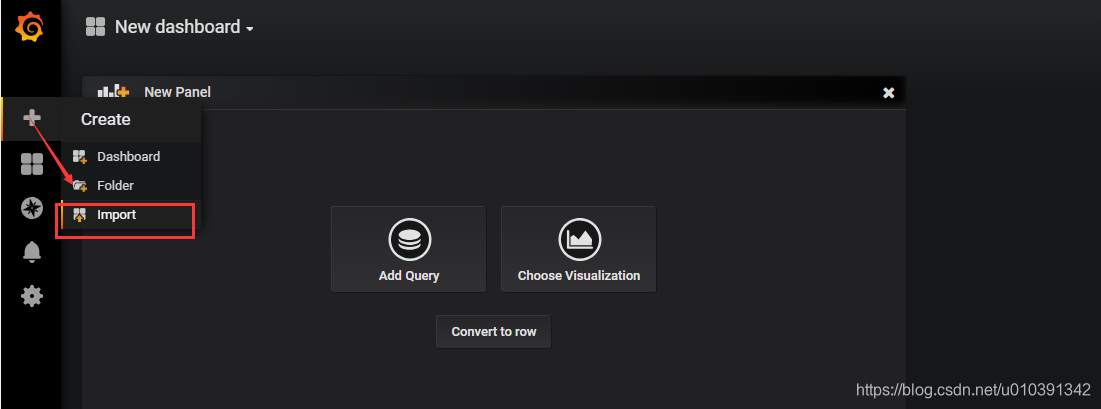
- 开始导入,输入模板ID 点击
Load

- 设置

- 添加完成
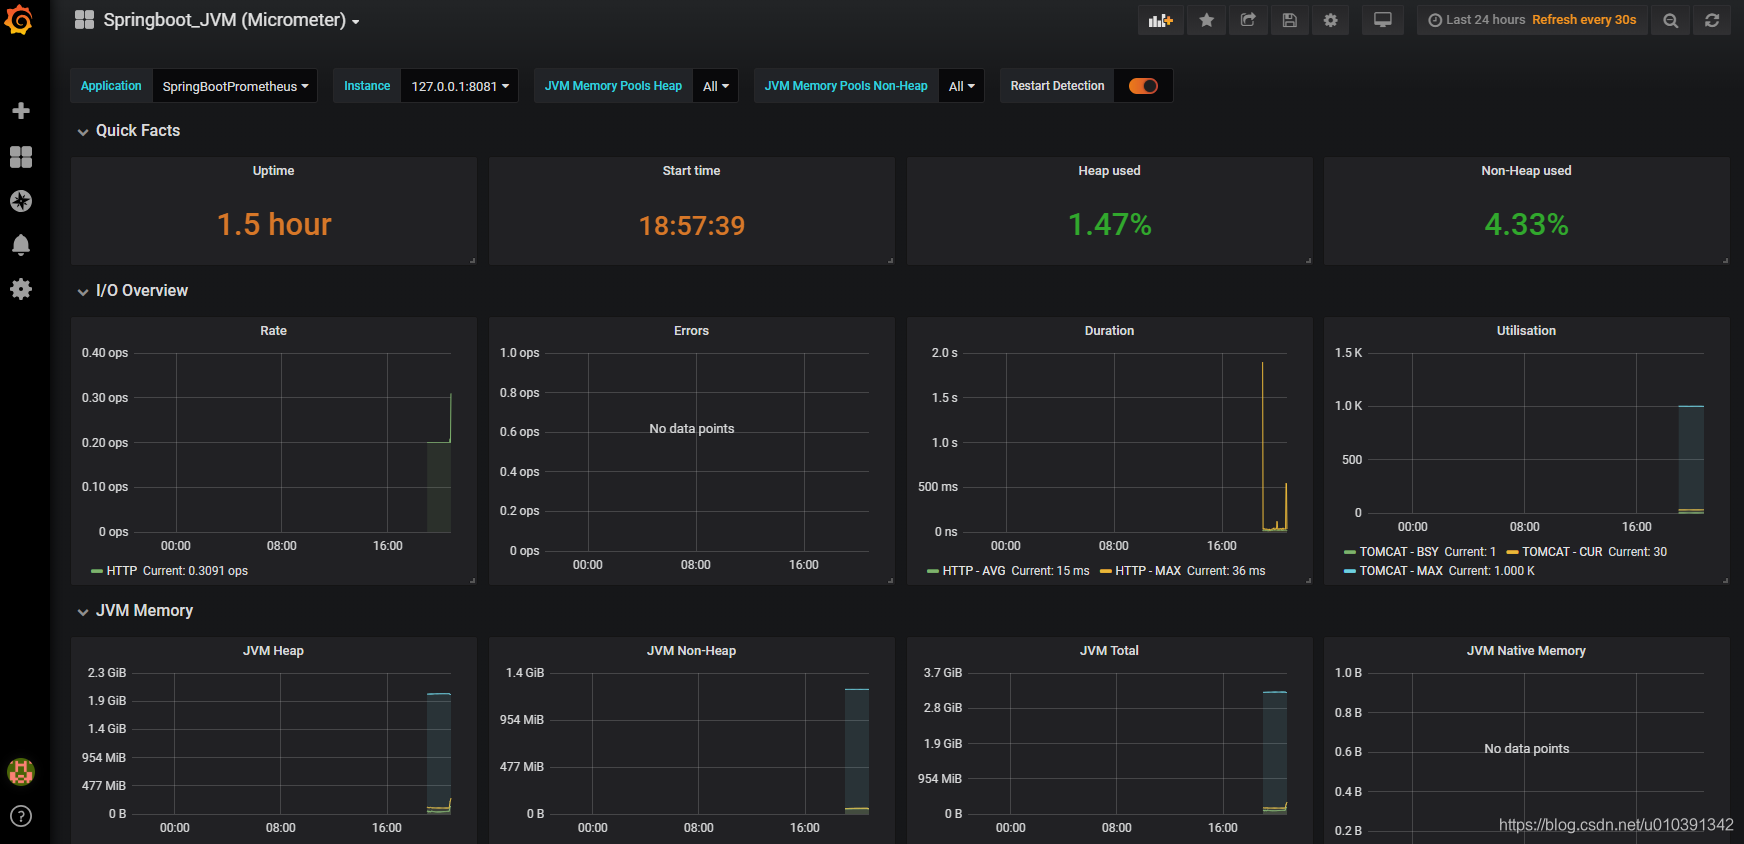
- Grafana还支持很多数据源的监控, 后续在慢慢研究