文章目录
1. Prometheus 概述
Prometheus(普罗米修斯)是一套开源的监控&报警&时间序列数据库的组合,现在最常见的 Docker、Mesos、Kubernetes 容器管理系统中,通常会搭配Prometheus 进行监控。
Prometheus 基本原理是通过 HTTP 协议周期性抓取被监控组件的状态,这样做的好处是任意组件只
要提供 HTTP 接口就可以接入监控系统,无需要任何 SDK 或者者其他的集成过程。这样做非常适合虚拟化环境比如 VM 或者 Docker 。
输出被监控组件信息的 HTTP 接口被叫做 exporter。目前互联网公司常用的组件大部分都有
exporter 可以直接使用,比如 Varnish、Haproxy、Nginx、MySQL、Linux 系统信息 (包括磁盘、
内存、CPU、网络等等),具体支持的源看:https://github.com/prometheus
2. Prometheus 架构图解
2.1 Prometheus 各组件运行流程如下:
1、Prometheus Server:Prometheus Sever 是 Prometheus 组件中的核心部分,负责实现对监
控数据的获取,存储及查询。Prometheus Server 可以通过静态配置管理监控目标,也可以配合使用
Service Discovery(服务发现)的方式动态管理监控目标,并从这些监控目标中获取数据。其次
Prometheus Sever 需要对采集到的数据进行存储,Prometheus Server 本身就是一个实时数据库,将
采集到的监控数据按照时间序列的方式存储在本地磁盘当中。Prometheus Server 对外提供了自定义的PromQL,实现对数据的查询以及分析。另外 Prometheus Server 的联邦集群能力可以使其从其他的Prometheus Server 实例中获取数据。
2、Exporters:Exporter将监控数据采集的端点通过 HTTP 服务的形式暴露给Prometheus Server,
Prometheus Server 通过访问该 Exporter 提供的 Endpoint 端点,即可以获取到需要采集的监控数据。可以将 Exporter 分为 2 类:
(1) 直接采集:这一类 Exporter 直接内置了对 Prometheus 监控的支持,比如 cAdvisor,Kubernetes,Etcd等,都直接内置了用于向 Prometheus 暴露监控数据的端点。
(2) 间接采集:原有监控目标并无直接支持 Prometheus,因此需要通过 Prometheus 提供的 Client
Library 编写该监控目标的监控采集程序。例如:Mysql Exporter,JMX Exporter,Consul Exporter等。
3、AlertManager:在 Prometheus Server 中支持基于 Prom QL 创建告警规则,如果满足 Prom QL 定义的规则,则会产生一条告警。常见的接收方式有:电子邮件,webhook 等。
4、PushGateway:Prometheus 数据采集基于 Prometheus Server 从 Exporter pull 数据,因此
当网络环境不允许 Prometheus Server和 Exporter 进行通信时,可以使用 PushGateway 来进行中转。
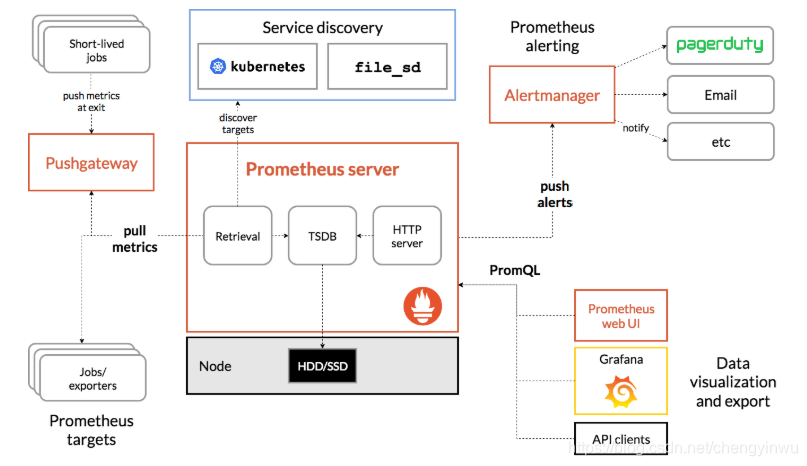
Prometheus 的工作流:
1.Prometheus server 定期从配置好的 jobs 和 exporters 中拉取 metrics,或者接收来自Pushgateway 发送过来的 metrics,或者从其它的 Prometheus server 中拉 metrics。
2.Prometheus server 在本地存储收集到的 metrics,并运行定义好的 alerts.rules,记录新的时间序列或者向 Alert manager 推送警报。
3.Alertmanager根据配置文件,对接收到的报进行处理,发出告警.
4.在图形界面中,可视化采集数据。
3. 安装配置 Prometheus 监控服务
1.安装Go语言环境
[root@web01 ~]# yum install go -y
[root@web01 ~]# go version
go version go1.13.6 linux/amd64
2.下载安装 Prometheus(https://prometheus.io/download/)
[root@web01 ~]# tar xf prometheus-2.7.1.linux-amd64.tar.gz -C /usr/local/
[root@web01 ~]# cd /usr/local/prometheus-2.7.1.linux-amd64/
修改prometheus配置文件,配置监控linux主机和mysq|数据库,配置文件为yml语法.注意缩进对齐
[root@web01 prometheus-2.7.1.linux-amd64]# vim prometheus.yml
在最后一行进行配置:
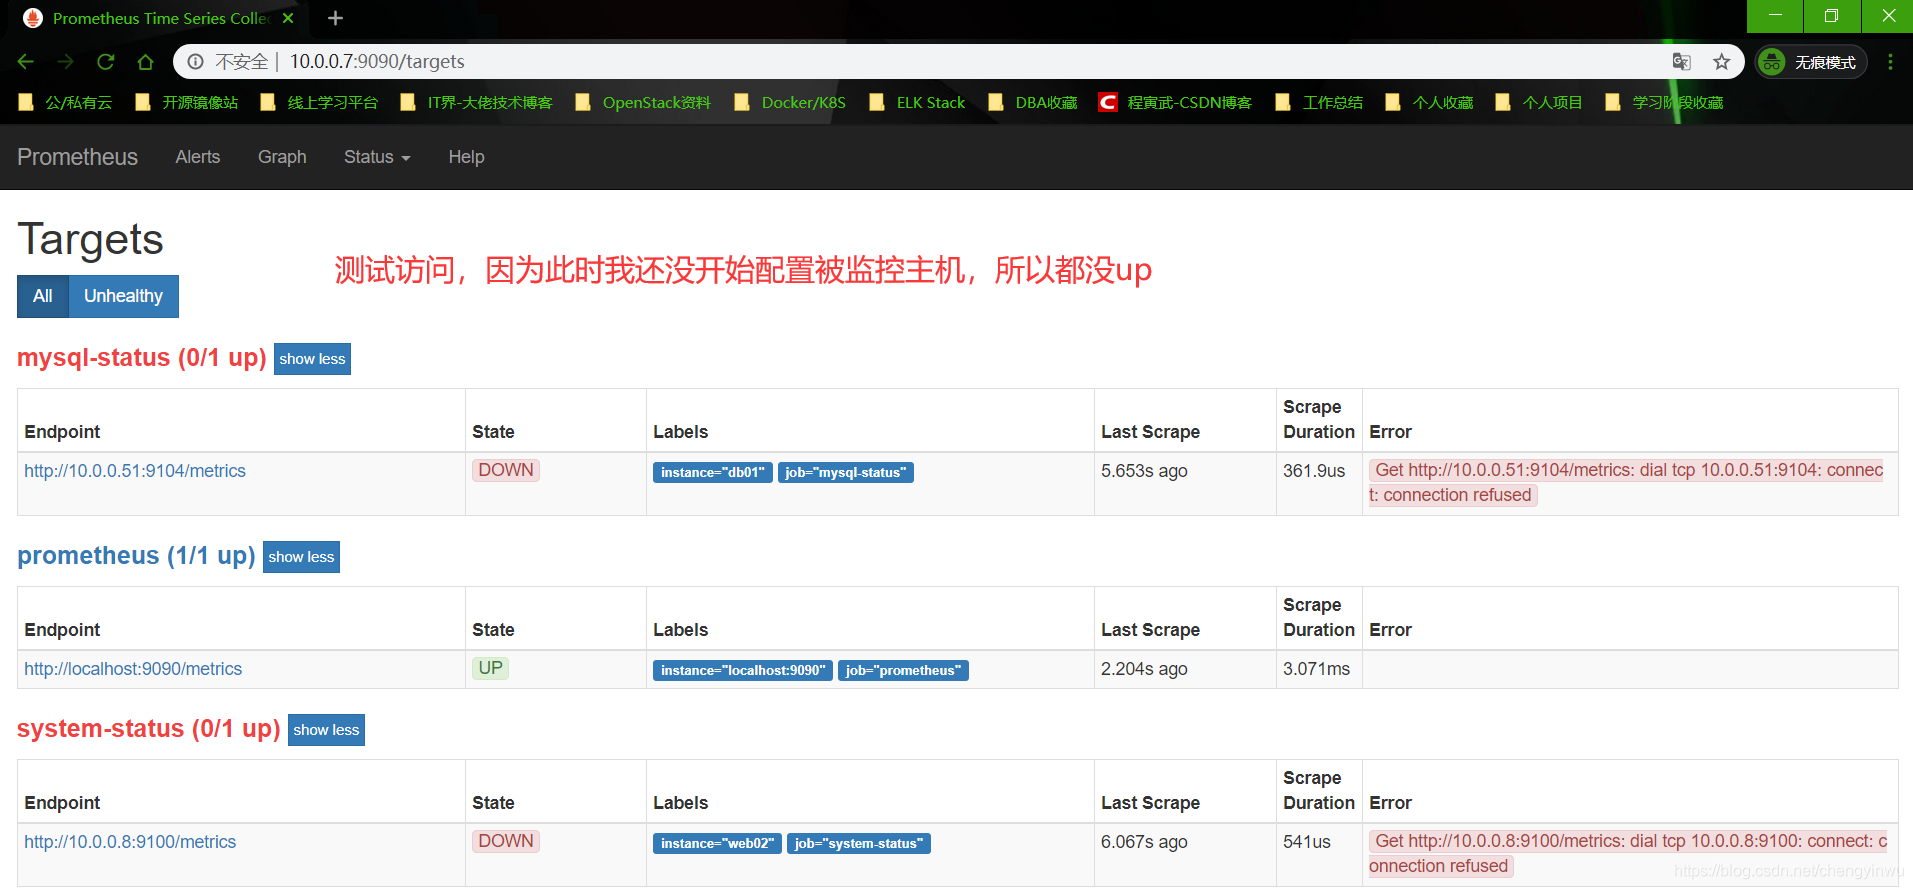
- job_name: 'system-status' #每一个 job_name 都是一个监控项,这里代表监控操作系统状态
static_configs:
- targets: ['10.0.0.8:9100'] #被监控主机 IP 地址和端口
labels:
instance: web02 #实例名称,在 grafana 中表示对应的主机
- job_name: 'mysql-status' #监控 mysql 数据库状态
static_configs:
- targets: ['10.0.0.51:9104'] #数据库Ip地址+端口
labels:
instance: db01 #实例名称,在 grafana 中表示对应的主机
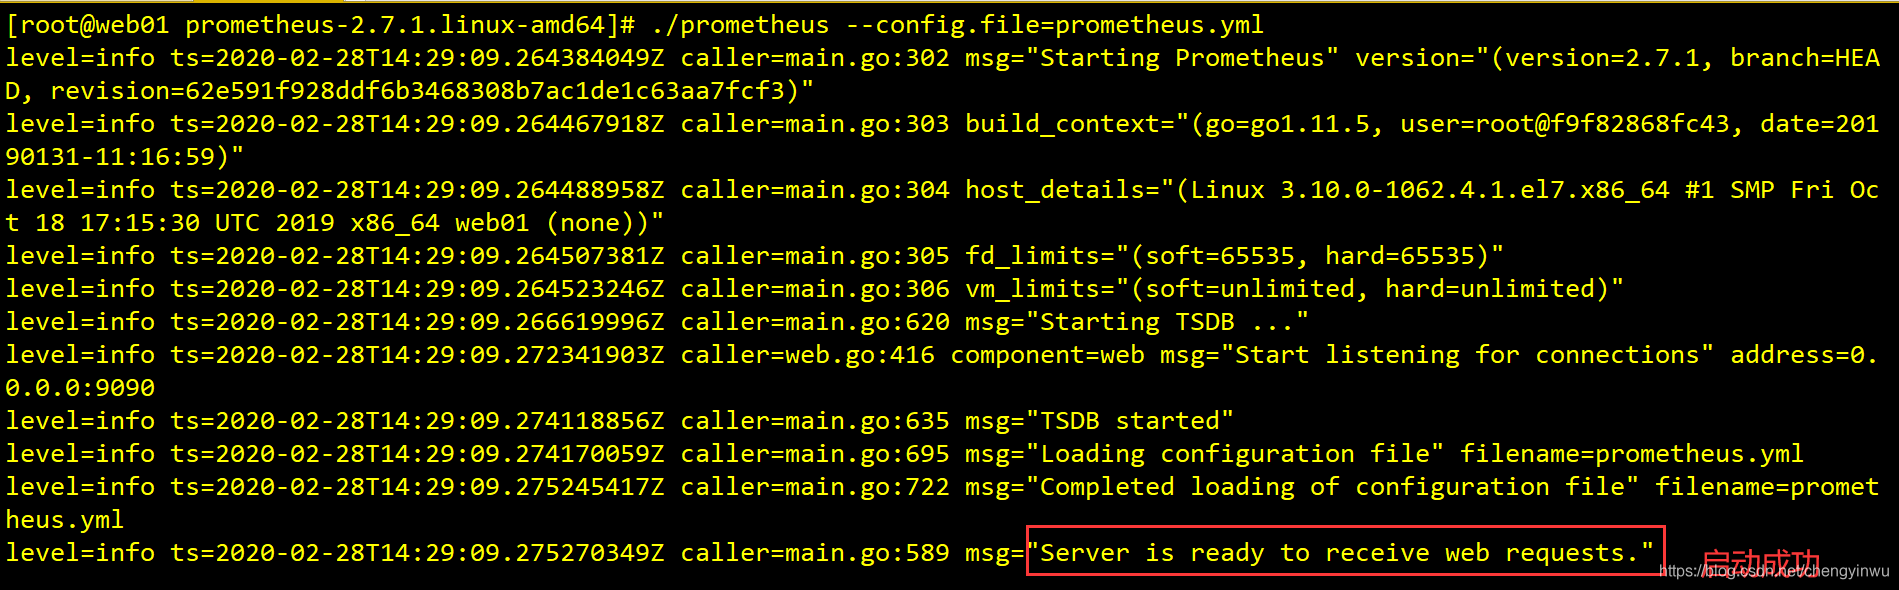
./prometheus --config.file=prometheus.yml & 放置后台运行
4. 启动用于采集 Linux 系统和 mysql 服务状态的 exporter 服务
prometheus常见的exporter及作用:
(1). node. exporter 用于监控操作系统的性能和运行状态
(2). mysqld. exporter用于监控mysql服务
(3). snmp. exporter 用于监控网络设备
更多exporter可在官网下载官方传送门—》
1. 配置 node_exporter 监控 web02 运行状态
[root@web02 ~]# tar xf node_exporter-0.17.0.linux-amd64.tar.gz -C /usr/local/
[root@web02 ~]# /usr/local/node_exporter-0.17.0.linux-amd64/node_exporter &

2、配置 mysqld_exporter 用于监控 db01 上的 mysql 服务
2.1 登录数据库:
mysql> grant replication client,process on *.* to 'mysql_monitor'@'localhost' identified by '123456';
Query OK, 0 rows affected, 1 warning (0.00 sec)

mysql> grant select on *.* to 'mysql_monitor'@'localhost';
Query OK, 0 rows affected (0.00 sec)

mysql> exit
Bye

2.2 安装 mysqld_exporter
[root@db01 ~]# tar xf mysqld_exporter-0.11.0.linux-amd64.tar.gz -C /usr/local/
[root@db01 ~]# cd /usr/local/mysqld_exporter-0.11.0.linux-amd64/
[root@db01 /usr/local/mysqld_exporter-0.11.0.linux-amd64]# vim .my.cnf  隐藏文件
[client]
user=mysql_monitor
password= 123456

[root@db01 ~]# /usr/local/mysqld_exporter-0.11.0.linux-amd64/mysqld_exporter --config.my-cnf="/usr/local/mysqld_exporter-0.11.0.linux-amd64/.my.cnf" &
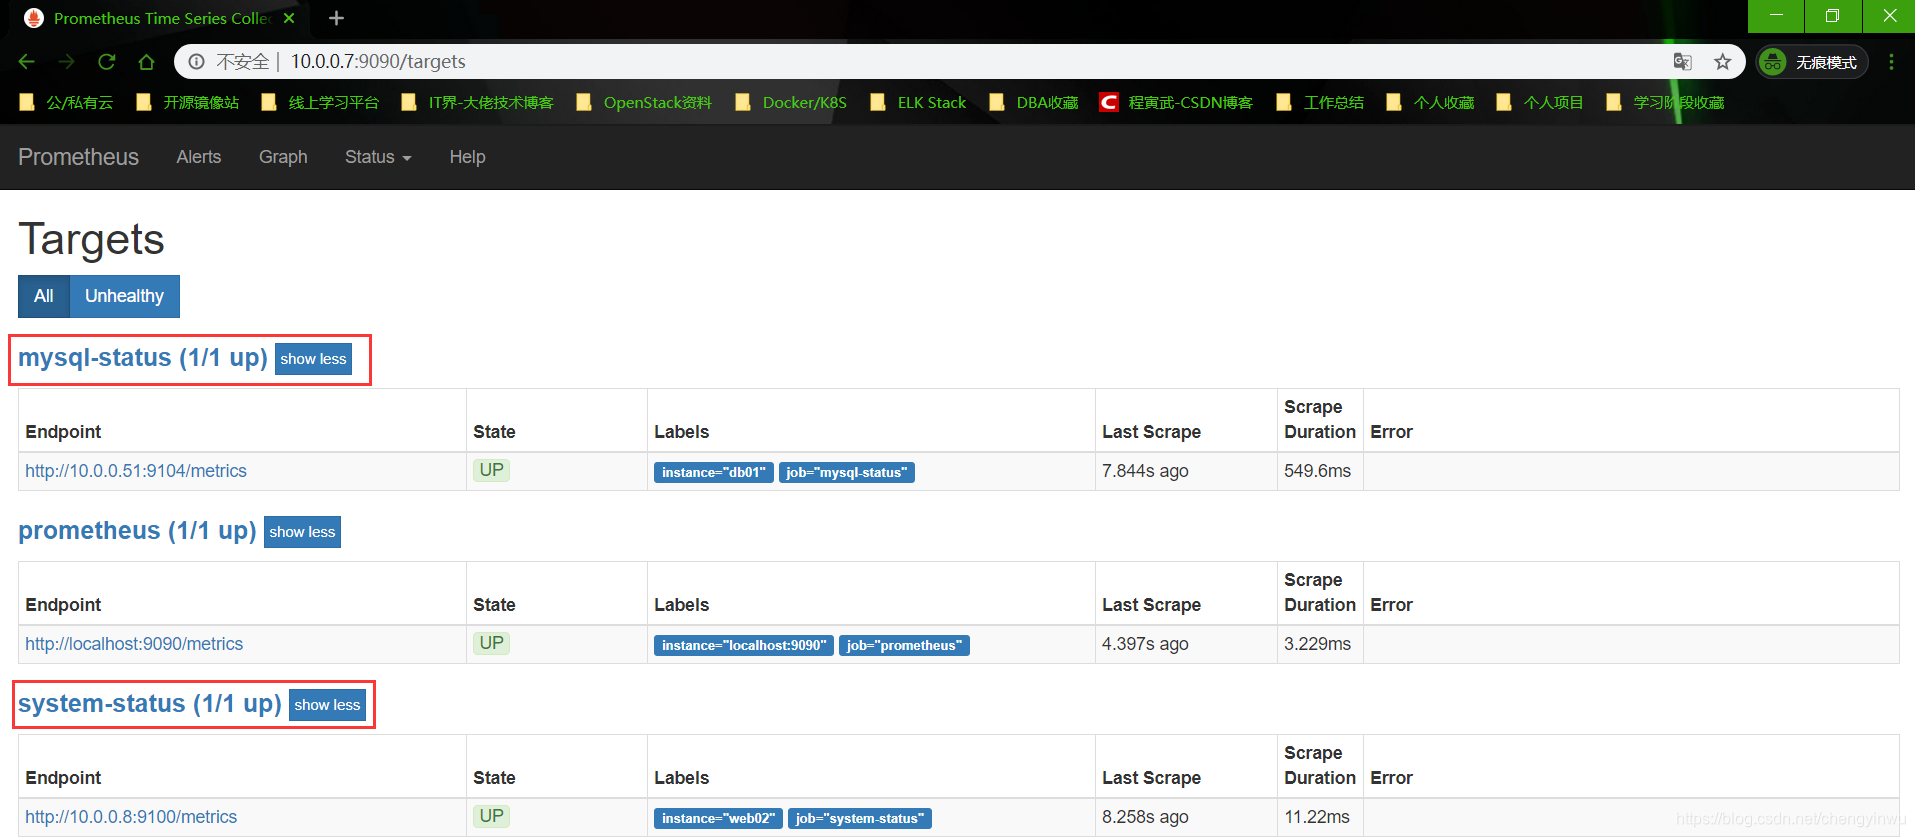
再次验证是否已添加节点并UP:
总结prometheus使用方法:
1.想监控操作系统,只需要一步:
在被监控系统上安装node. exporter并启动就ok了
2.想监控操mysql数据库,只需要两步:
(1).创建一个mysql用户
(2).安装mysqld. exporter 并启动
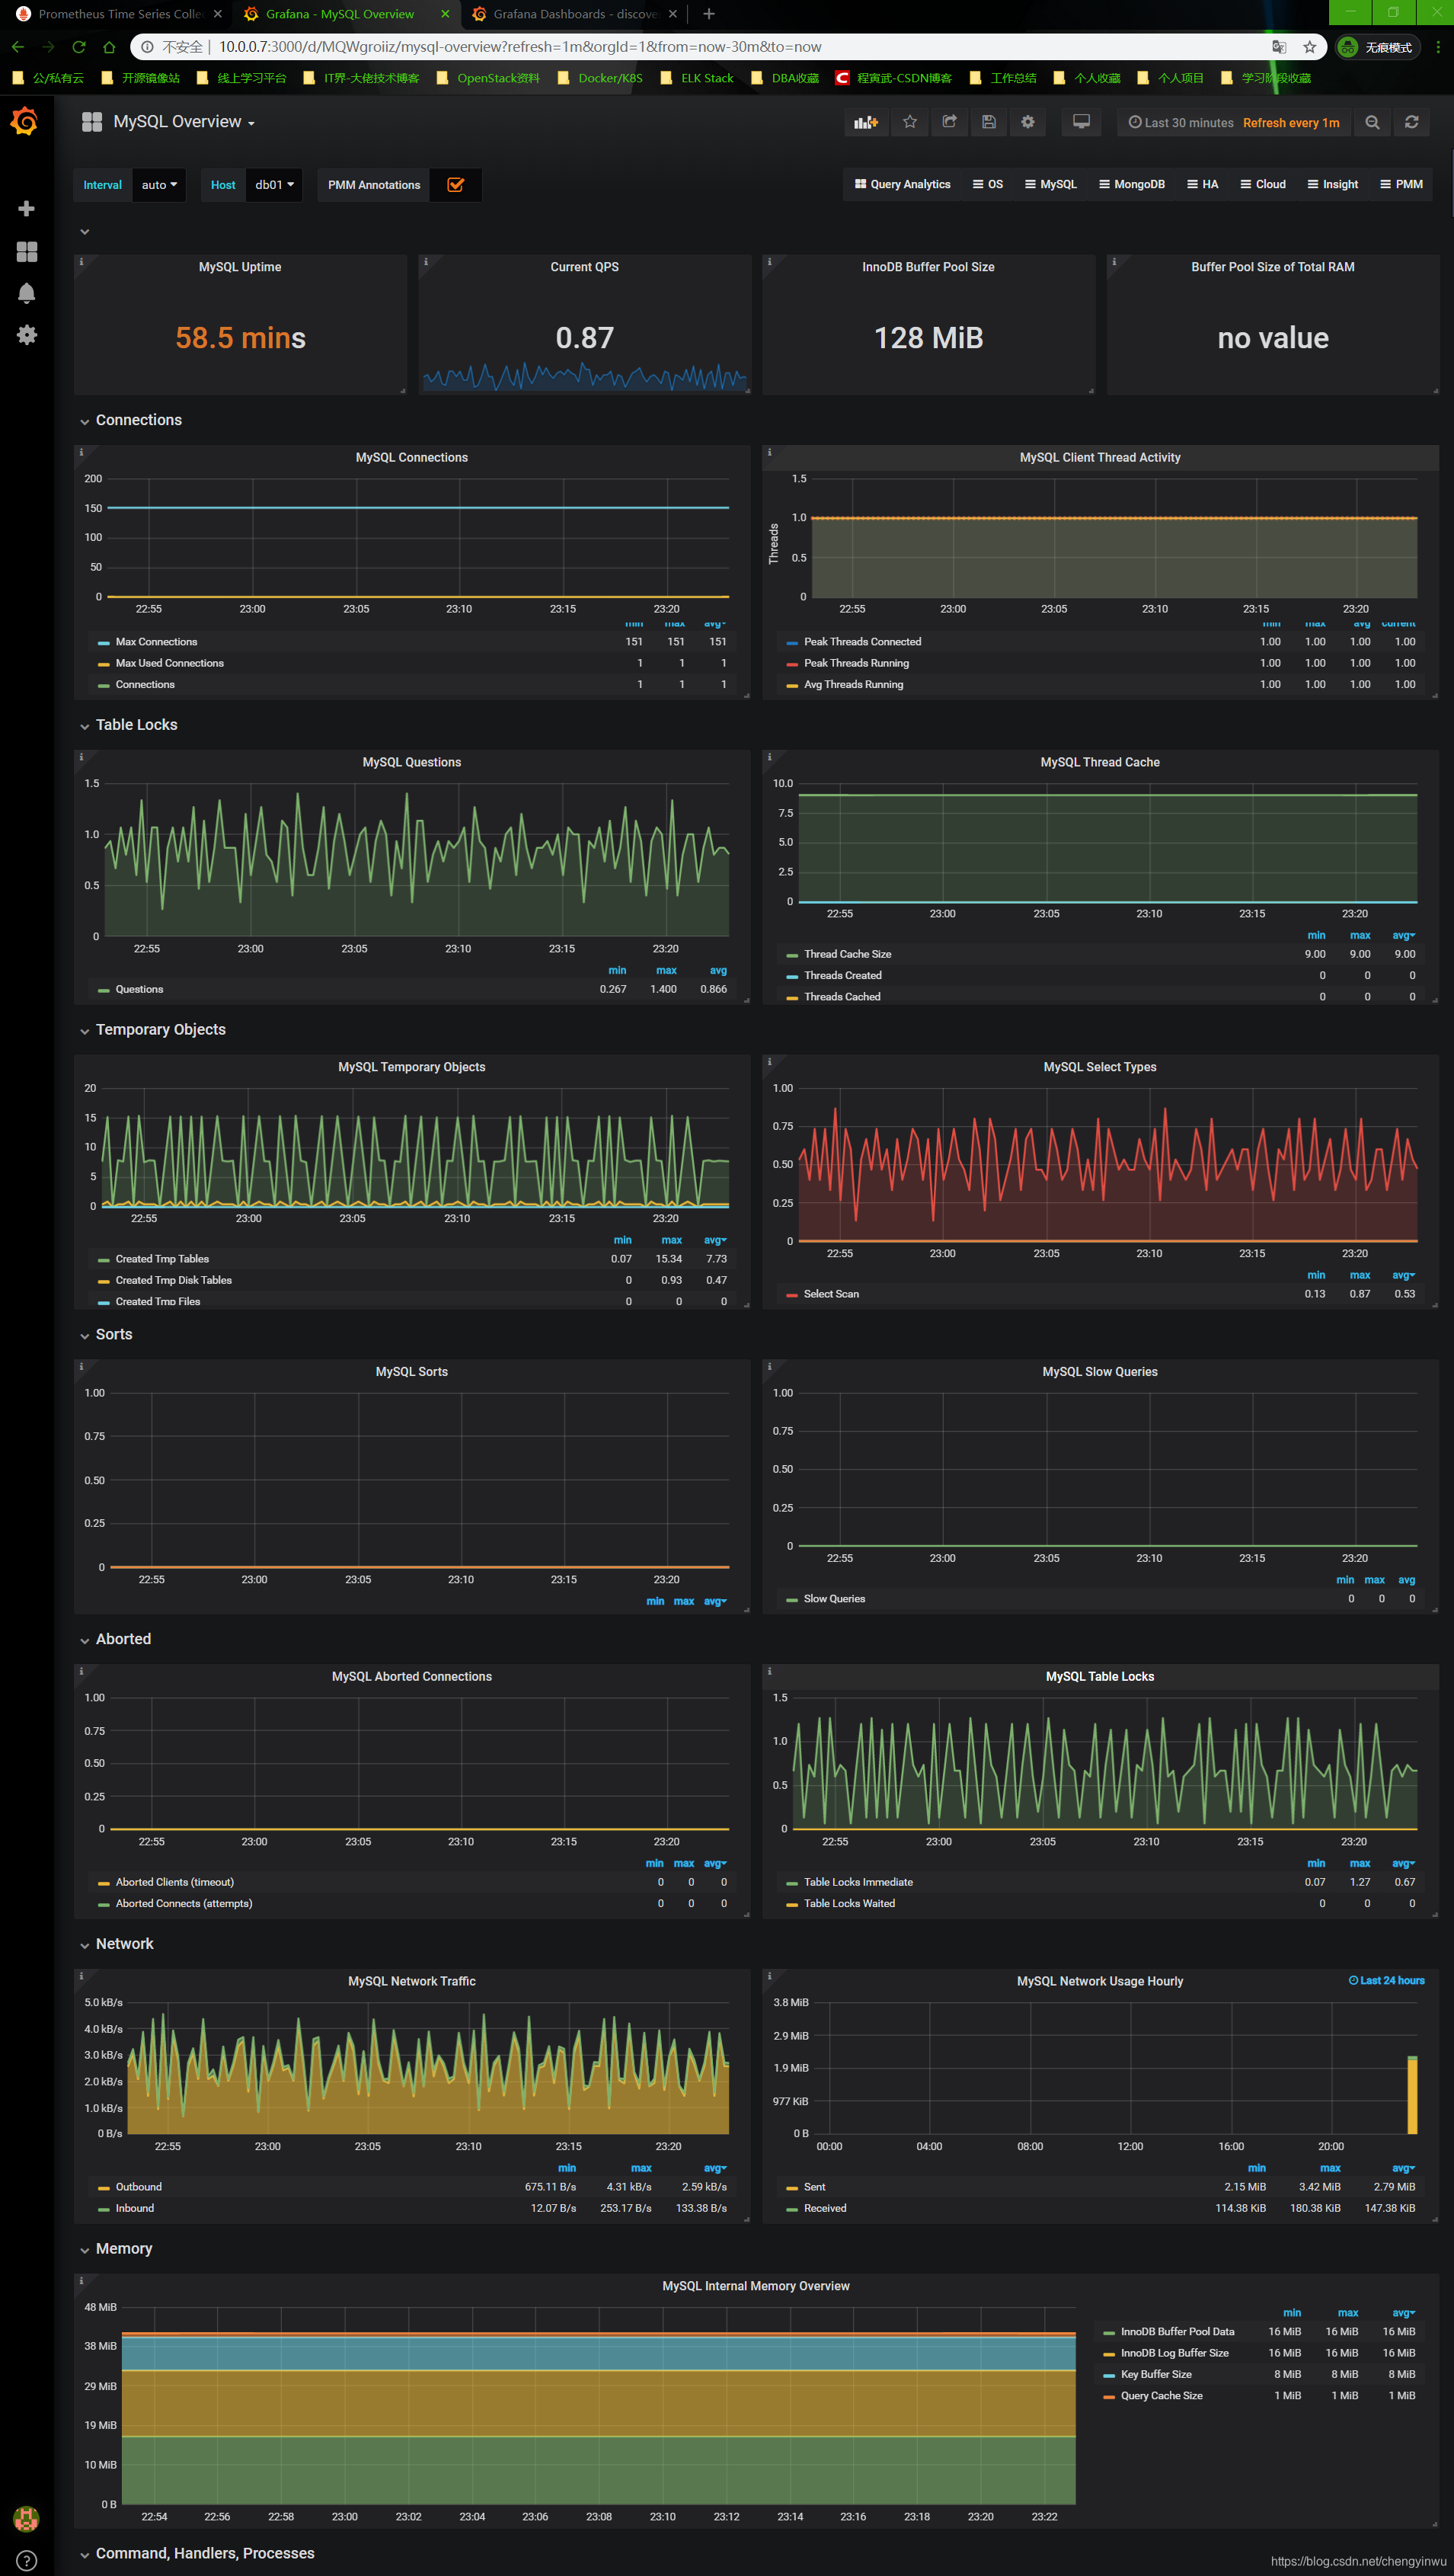
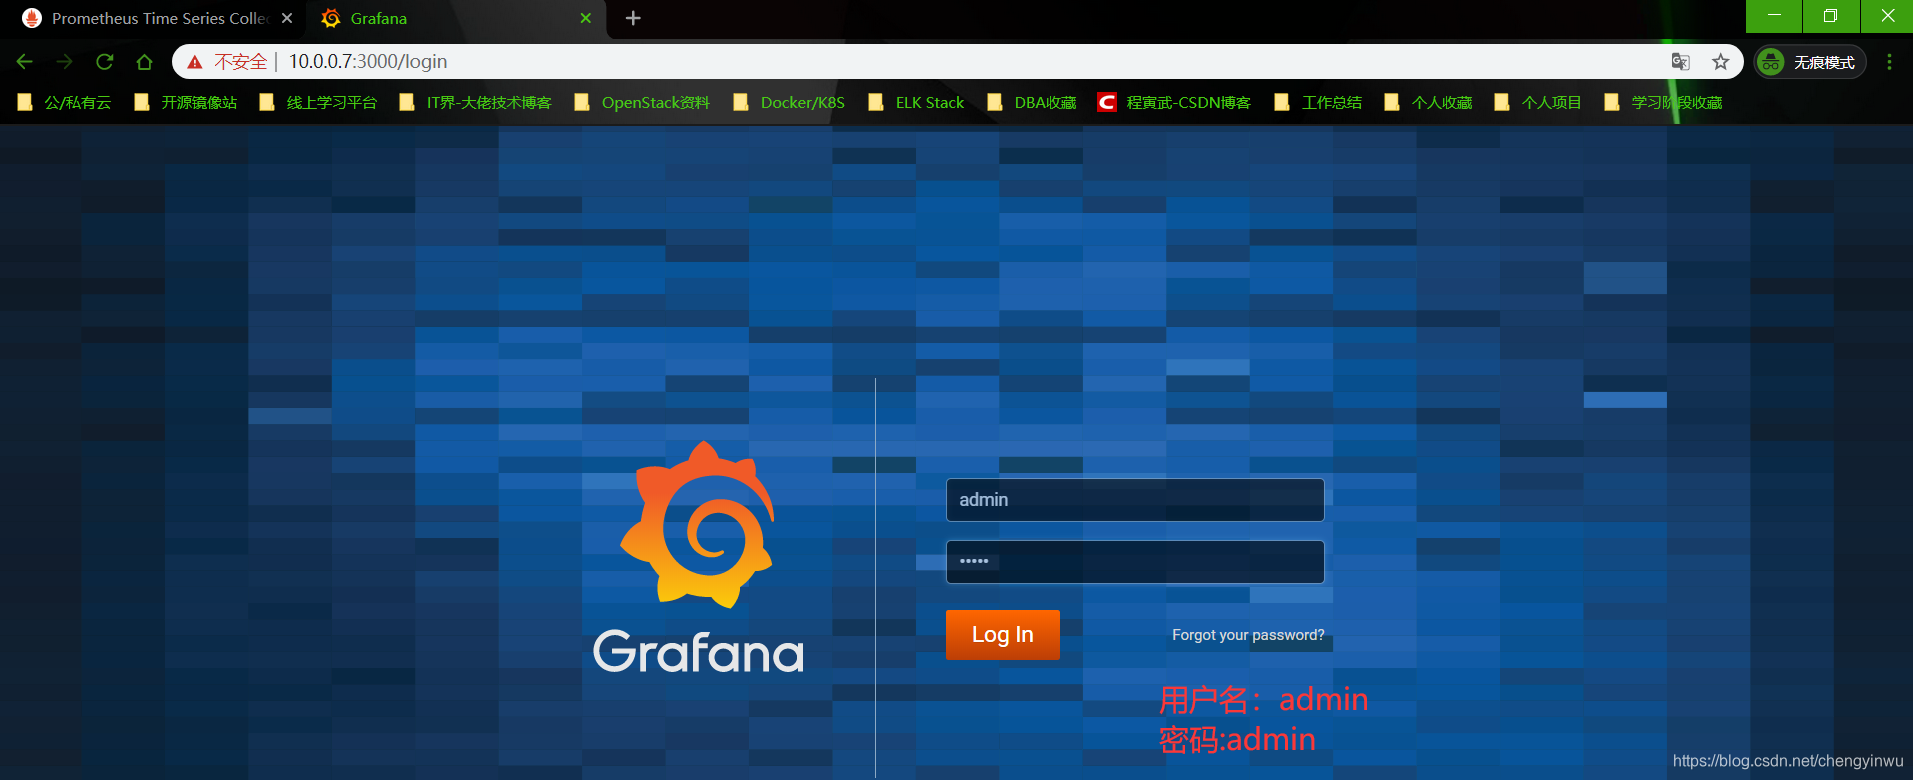
5. 使用 Grafana 可视化工具美化监控数据
1.安装配置grafana
[root@web01 ~]# yum install grafana-5.4.3-1.x86_64.rpm -y

2.安装出图插件
[root@web01 ~]# grafana-cli plugins install grafana-piechart-panel

3.装完插件需restart服务
[root@web01 ~]# service grafana-server restart
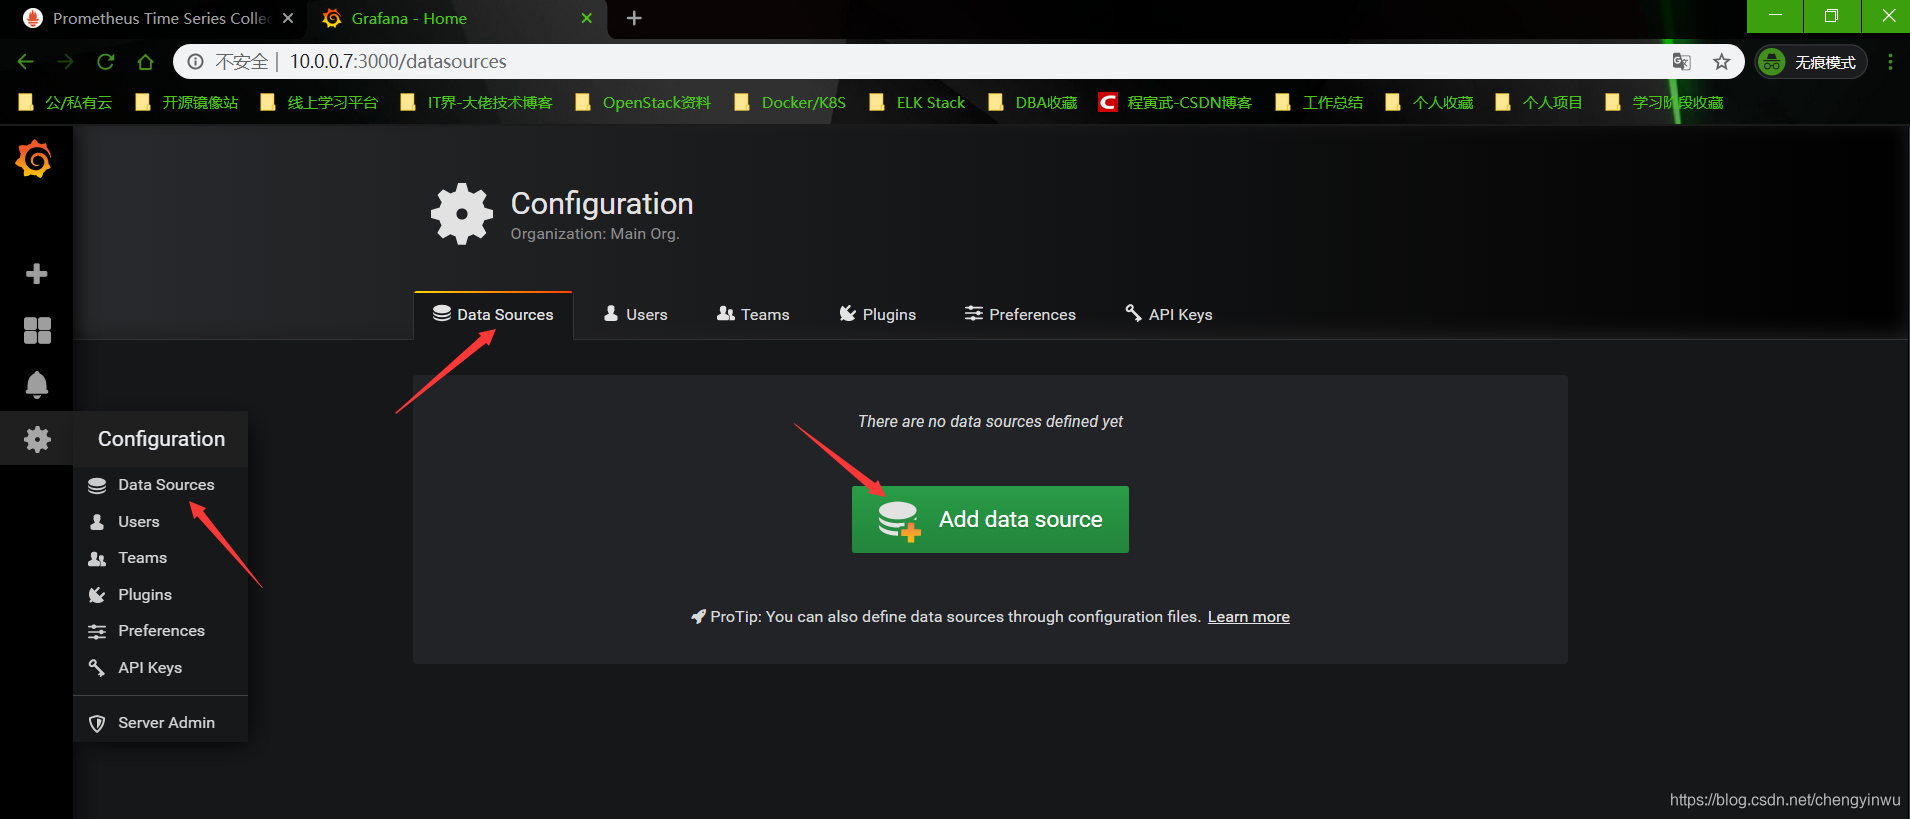
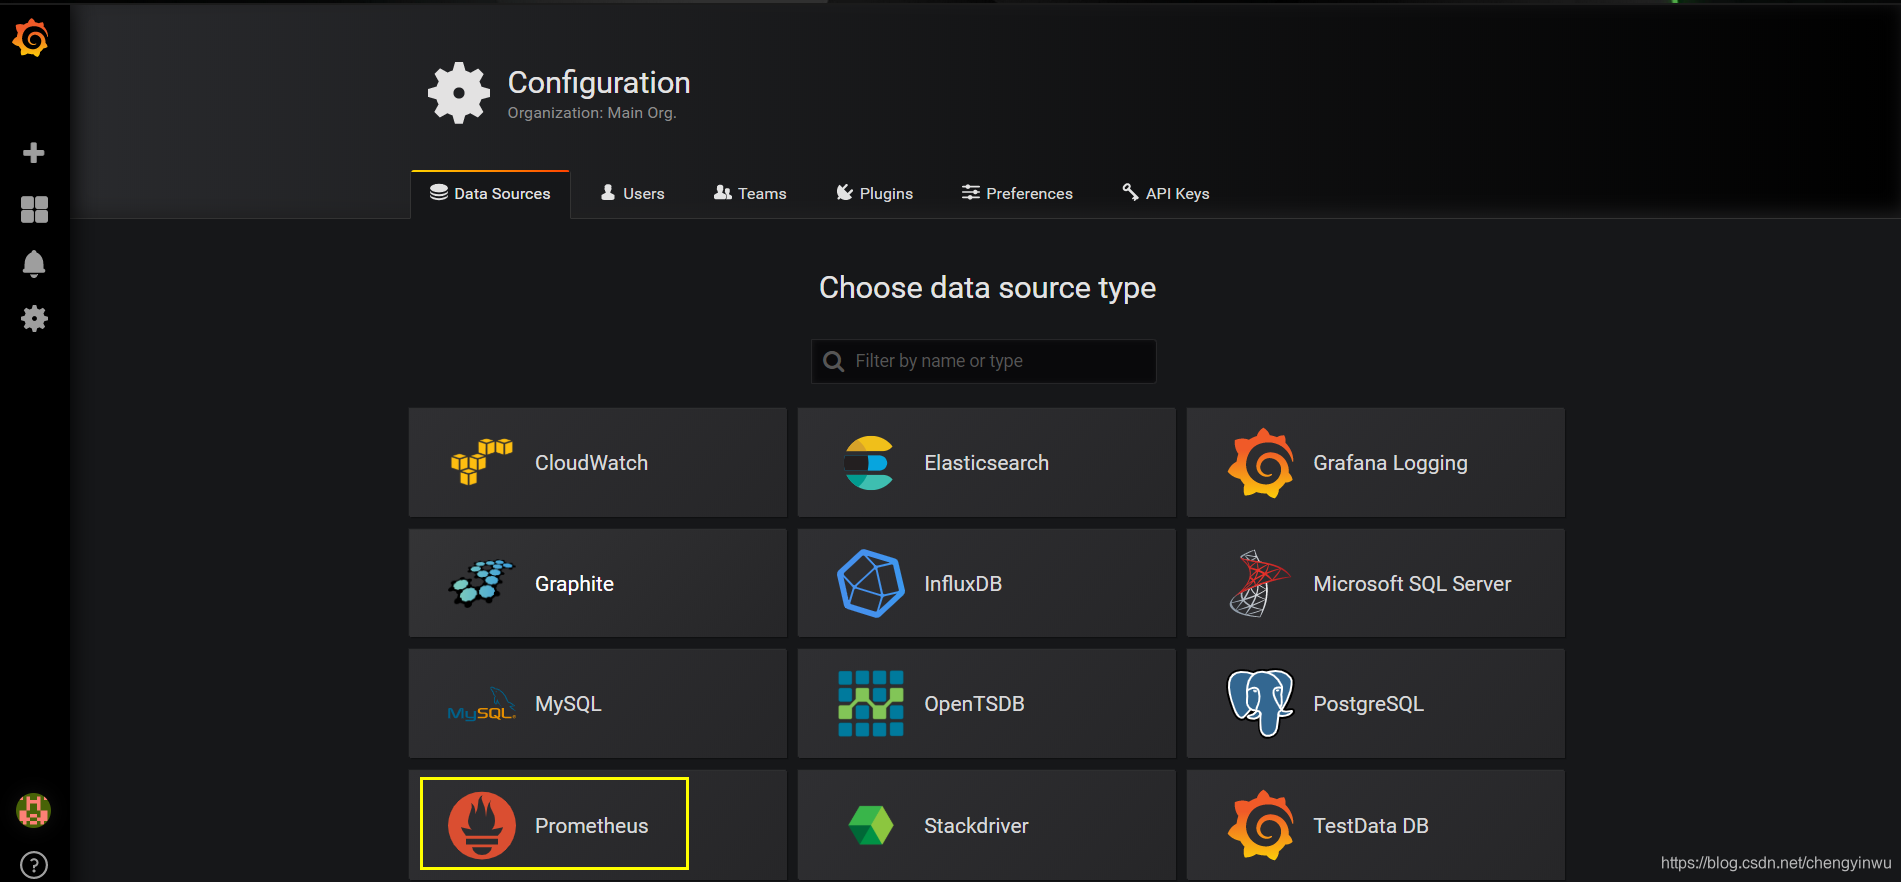
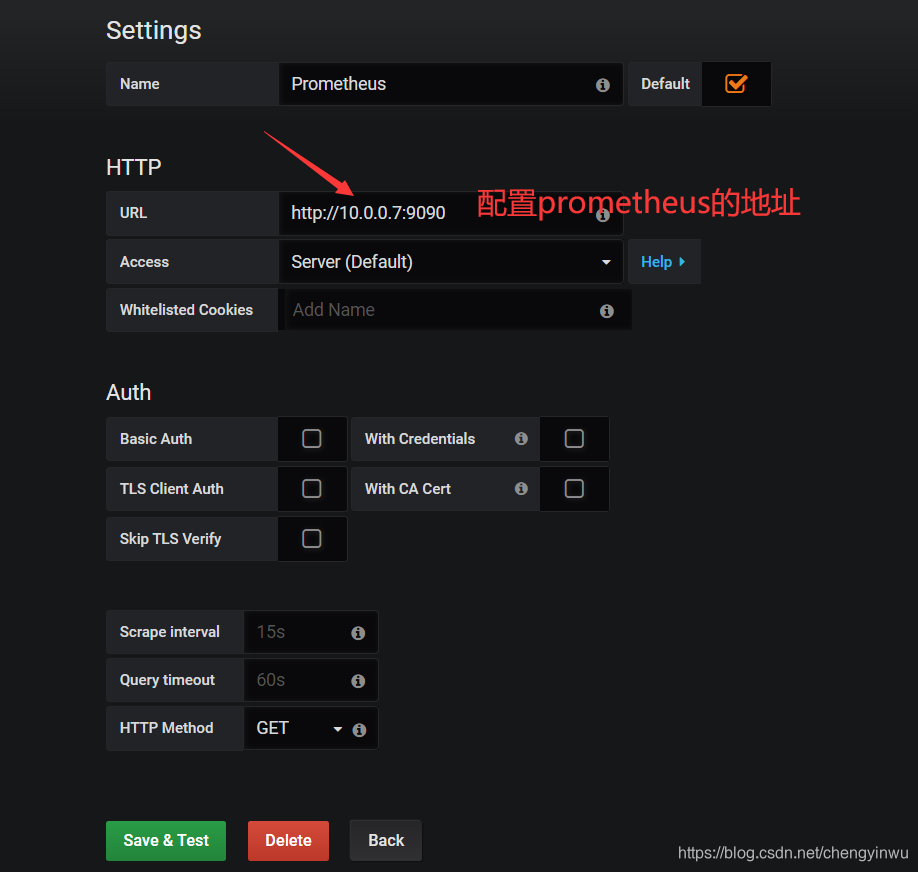
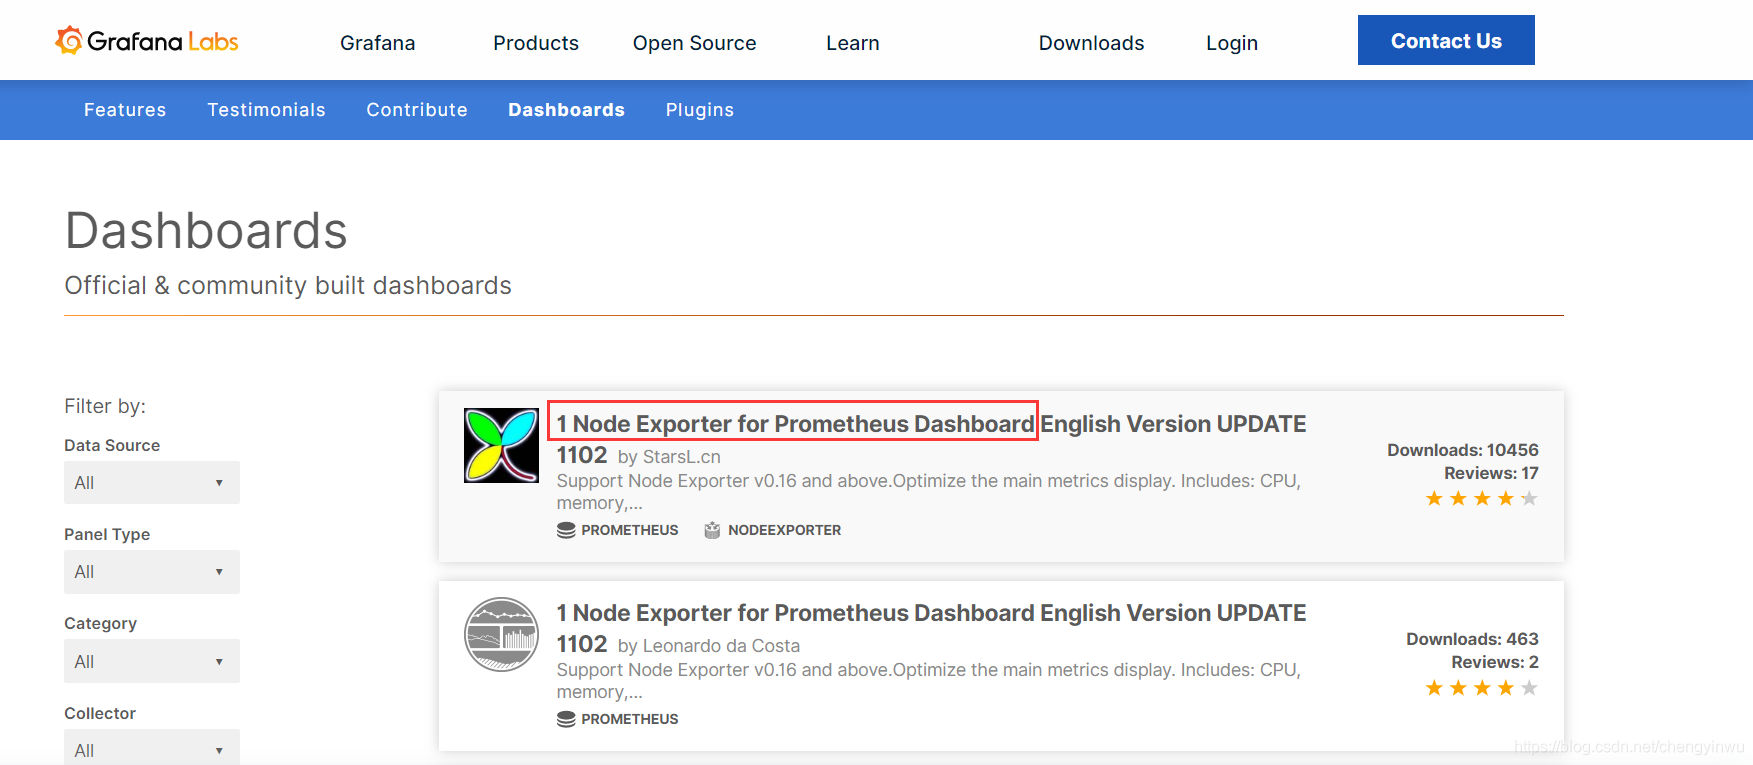
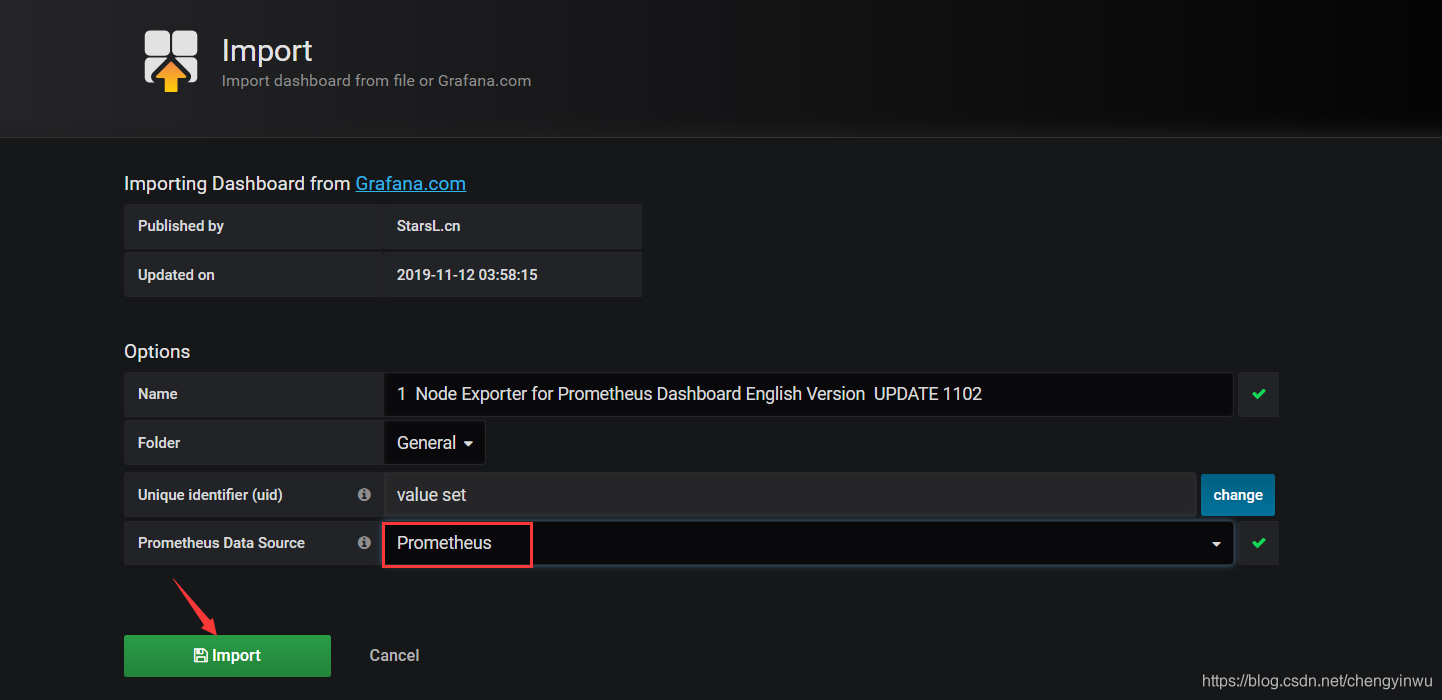
6. 将监控 Linux 系统和 mysql 服务运行状态的 web 仪表盘插件导入 grafana