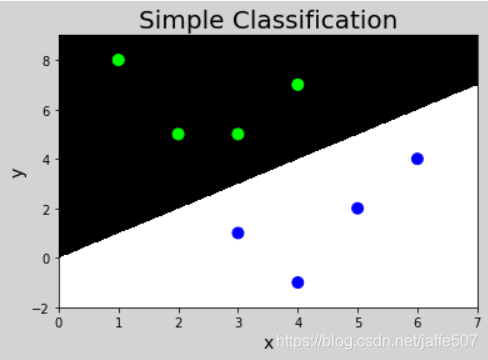
人工分类
| 特征1 |
特征2 |
输出 |
| 3 |
1 |
0 |
| 2 |
5 |
1 |
| 1 |
8 |
1 |
| 6 |
4 |
0 |
| 5 |
2 |
0 |
| 3 |
5 |
1 |
| 4 |
7 |
1 |
| 4 |
-1 |
0 |
| … |
… |
… |
| 6 |
8 |
1 |
| 5 |
1 |
0 |
import numpy as np
import matplotlib.pyplot as mp
x = np.array([
    [3, 1],
    [2, 5],
    [1, 8],
    [6, 4],
    [5, 2],
    [3, 5],
    [4, 7],
    [4, -1]])
y = np.array([0, 1, 1, 0, 0, 1, 1, 0])
l, r = x[:, 0].min() - 1, x[:, 0].max() + 1
b, t = x[:, 1].min() - 1, x[:, 1].max() + 1
n = 500
grid_x, grid_y = np.meshgrid(np.linspace(l, r, n), np.linspace(b, t, n))
grid_z = np.piecewise(grid_x, [grid_x>grid_y, grid_x<grid_y], [1, 0])

mp.figure('Simple Classification', facecolor='lightgray')
mp.title('Simple Classification', fontsize=20)
mp.xlabel('x', fontsize=14)
mp.ylabel('y', fontsize=14)
mp.tick_params(labelsize=10)
mp.pcolormesh(grid_x, grid_y, grid_z, cmap='gray')
mp.scatter(x[:, 0], x[:, 1], c=y, cmap='brg', s=80)
mp.show()
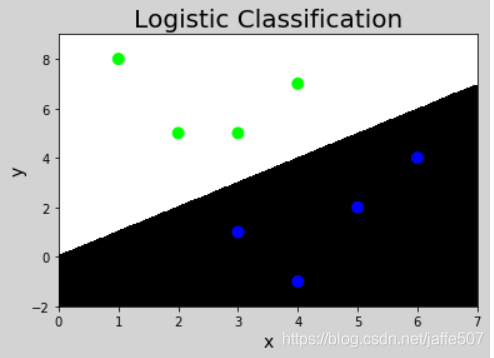
逻辑回归实现分类
import numpy as np
import sklearn.linear_model as lm
import matplotlib.pyplot as mp
x = np.array([
[3, 1],
[2, 5],
[1, 8],
[6, 4],
[5, 2],
[3, 5],
[4, 7],
[4, -1]])
y = np.array([0, 1, 1, 0, 0, 1, 1, 0])`
model = lm.LogisticRegression(solver='liblinear', C=1)
model.fit(x, y)
l, r = x[:, 0].min() - 1, x[:, 0].max() + 1
b, t = x[:, 1].min() - 1, x[:, 1].max() + 1
n = 500
grid_x, grid_y = np.meshgrid(np.linspace(l, r, n), np.linspace(b, t, n))
samples = np.column_stack((grid_x.ravel(), grid_y.ravel()))
grid_z = model.predict(samples)
grid_z = grid_z.reshape(grid_x.shape)
mp.figure('Logistic Classification', facecolor='lightgray')
mp.title('Logistic Classification', fontsize=20)
mp.xlabel('x', fontsize=14)
mp.ylabel('y', fontsize=14)
mp.tick_params(labelsize=10)
mp.pcolormesh(grid_x, grid_y, grid_z, cmap='gray')
mp.scatter(x[:, 0], x[:, 1], c=y, cmap='brg', s=80)
mp.show()
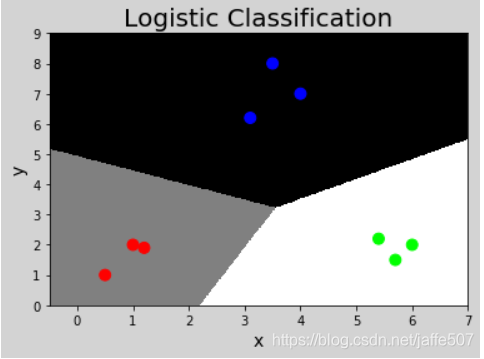
逻辑回归实现多分类
import numpy as np
import sklearn.linear_model as lm
import matplotlib.pyplot as mp
x = np.array([
[4, 7],
[3.5, 8],
[3.1, 6.2],
[0.5, 1],
[1, 2],
[1.2, 1.9],
[6, 2],
[5.7, 1.5],
[5.4, 2.2]])
y = np.array([0, 0, 0, 1, 1, 1, 2, 2, 2])
model = lm.LogisticRegression(solver='liblinear', C=1000)
model.fit(x, y)
l, r = x[:, 0].min() - 1, x[:, 0].max() + 1
b, t = x[:, 1].min() - 1, x[:, 1].max() + 1
n = 500
grid_x, grid_y = np.meshgrid(np.linspace(l, r, n), np.linspace(b, t, n))
samples = np.column_stack((grid_x.ravel(), grid_y.ravel()))
grid_z = model.predict(samples)
print(grid_z)
grid_z = grid_z.reshape(grid_x.shape)
mp.figure('Logistic Classification', facecolor='lightgray')
mp.title('Logistic Classification', fontsize=20)
mp.xlabel('x', fontsize=14)
mp.ylabel('y', fontsize=14)
mp.tick_params(labelsize=10)
mp.pcolormesh(grid_x, grid_y, grid_z, cmap='gray')
mp.scatter(x[:, 0], x[:, 1], c=y, cmap='brg', s=80)
mp.show()