目录
1.写在前面
循环神经网络让神经网络有了记忆, 对于序列话的数据,循环神经网络能达到更好的效果.上次我们提到了用 RNN 的最后一个时间点输出来判断之前看到的图片属于哪一类, 这次我们来真的了, 用 RNN 来及时预测时间序列.

2.训练数据
我们要用到的数据就是这样的一些数据, 我们想要用 sin 的曲线预测出 cos 的曲线.

import torch
from torch import nn
import numpy as np
import matplotlib.pyplot as plt

torch.manual_seed(1)    # reproducible

# Hyper Parameters
TIME_STEP = 10      # rnn time step / image height
INPUT_SIZE = 1      # rnn input size / image width
LR = 0.02           # learning rate
DOWNLOAD_MNIST = False  # set to True if haven't download the data
3.RNN模型
这一次的 RNN, 我们对每一个 r_out 都得放到 Linear 中去计算出预测的 output, 所以我们能用一个 for loop 来循环计算. 这点是 Tensorflow 望尘莫及的! 看看我们的 PyTorch 和 Tensorflow 到底哪家强.
class RNN(nn.Module):
    def __init__(self):
        super(RNN, self).__init__()

        self.rnn = nn.RNN(  # 这回一个普通的 RNN 就能胜任
            input_size=1,
            hidden_size=32,     # rnn hidden unit
            num_layers=1,       # 有几层 RNN layers
            batch_first=True,   # input & output 会是以 batch size 为第一维度的特征集 e.g. (batch, time_step, input_size)
        )
        self.out = nn.Linear(32, 1)

    def forward(self, x, h_state):  # 因为 hidden state 是连续的, 所以我们要一直传递这一个 state
        # x (batch, time_step, input_size)
        # h_state (n_layers, batch, hidden_size)
        # r_out (batch, time_step, output_size)
        r_out, h_state = self.rnn(x, h_state)   # h_state 也要作为 RNN 的一个输入

        outs = []    # 保存所有时间点的预测值
        for time_step in range(r_out.size(1)):    # 对每一个时间点计算 output
            outs.append(self.out(r_out[:, time_step, :]))
        return torch.stack(outs, dim=1), h_state


rnn = RNN()
print(rnn)
"""
RNN (
  (rnn): RNN(1, 32, batch_first=True)
  (out): Linear (32 -> 1)
)
"""
其实熟悉 RNN 的朋友应该知道, forward 过程中的对每个时间点求输出还有一招使得计算量比较小的. 不过上面的内容主要是为了呈现 PyTorch 在动态构图上的优势, 所以我用了一个 for loop 来搭建那套输出系统. 下面介绍一个替换方式. 使用 reshape 的方式整批计算.
def forward(self, x, h_state):
    r_out, h_state = self.rnn(x, h_state)
    r_out = r_out.view(-1, 32)
    outs = self.out(r_out)
    return outs.view(-1, 32, TIME_STEP), h_state
4.训练
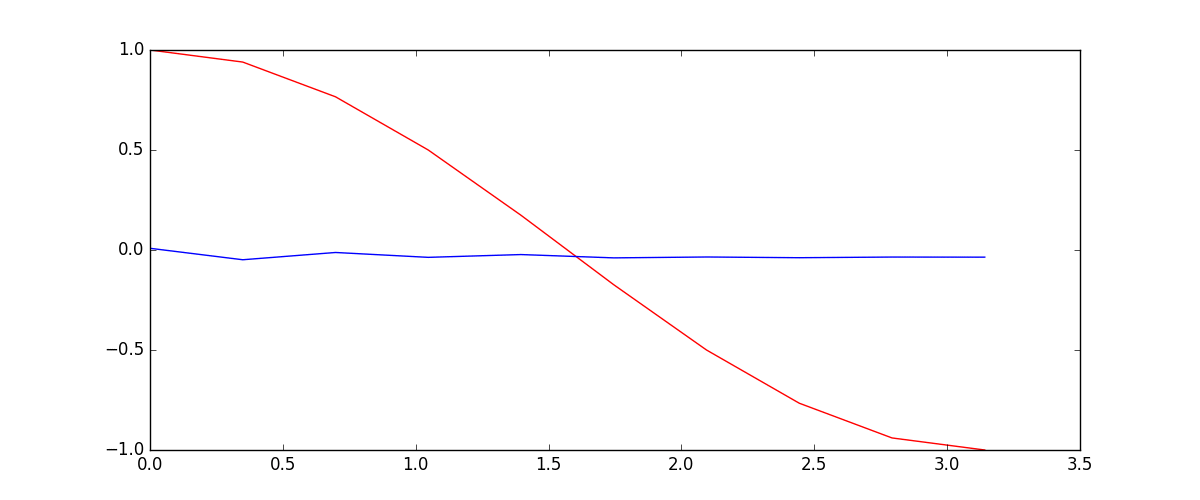
下面的代码就能实现动图的效果啦~开心, 可以看出, 我们使用 x 作为输入的 sin 值, 然后 y 作为想要拟合的输出, cos 值. 因为他们两条曲线是存在某种关系的, 所以我们就能用 sin 来预测 cos. rnn 会理解他们的关系, 并用里面的参数分析出来这个时刻 sin 曲线上的点如何对应上 cos 曲线上的点.
optimizer = torch.optim.Adam(rnn.parameters(), lr=LR)   # optimize all rnn parameters
loss_func = nn.MSELoss()

h_state = None   # 要使用初始 hidden state, 可以设成 None

for step in range(100):
    start, end = step * np.pi, (step+1)*np.pi   # time steps
    # sin 预测 cos
    steps = np.linspace(start, end, 10, dtype=np.float32)
    x_np = np.sin(steps)    # float32 for converting torch FloatTensor
    y_np = np.cos(steps)

    x = torch.from_numpy(x_np[np.newaxis, :, np.newaxis])    # shape (batch, time_step, input_size)
    y = torch.from_numpy(y_np[np.newaxis, :, np.newaxis])

    prediction, h_state = rnn(x, h_state)   # rnn 对于每个 step 的 prediction, 还有最后一个 step 的 h_state
    # !!  下一步十分重要 !!
    h_state = h_state.data  # 要把 h_state 重新包装一下才能放入下一个 iteration, 不然会报错

    loss = loss_func(prediction, y)     # cross entropy loss
    optimizer.zero_grad()               # clear gradients for this training step
    loss.backward()                     # backpropagation, compute gradients
    optimizer.step()                    # apply gradients
5.完整代码演示
import torch
from torch import nn
import numpy as np
import matplotlib.pyplot as plt

# torch.manual_seed(1)    # reproducible

# Hyper Parameters
TIME_STEP = 10      # rnn time step
INPUT_SIZE = 1      # rnn input size
LR = 0.02           # learning rate

# show data
steps = np.linspace(0, np.pi*2, 100, dtype=np.float32)  # float32 for converting torch FloatTensor
x_np = np.sin(steps)
y_np = np.cos(steps)
plt.plot(steps, y_np, 'r-', label='target (cos)')
plt.plot(steps, x_np, 'b-', label='input (sin)')
plt.legend(loc='best')
plt.show()


class RNN(nn.Module):
    def __init__(self):
        super(RNN, self).__init__()

        self.rnn = nn.RNN(
            input_size=INPUT_SIZE,
            hidden_size=32,     # rnn hidden unit
            num_layers=1,       # number of rnn layer
            batch_first=True,   # input & output will has batch size as 1s dimension. e.g. (batch, time_step, input_size)
        )
        self.out = nn.Linear(32, 1)

    def forward(self, x, h_state):
        # x (batch, time_step, input_size)
        # h_state (n_layers, batch, hidden_size)
        # r_out (batch, time_step, hidden_size)
        r_out, h_state = self.rnn(x, h_state)

        outs = []    # save all predictions
        for time_step in range(r_out.size(1)):    # calculate output for each time step
            outs.append(self.out(r_out[:, time_step, :]))
        return torch.stack(outs, dim=1), h_state

        # instead, for simplicity, you can replace above codes by follows
        # r_out = r_out.view(-1, 32)
        # outs = self.out(r_out)
        # outs = outs.view(-1, TIME_STEP, 1)
        # return outs, h_state

        # or even simpler, since nn.Linear can accept inputs of any dimension
        # and returns outputs with same dimension except for the last
        # outs = self.out(r_out)
        # return outs

rnn = RNN()
print(rnn)

optimizer = torch.optim.Adam(rnn.parameters(), lr=LR)   # optimize all cnn parameters
loss_func = nn.MSELoss()

h_state = None      # for initial hidden state

plt.figure(1, figsize=(12, 5))
plt.ion()           # continuously plot

for step in range(100):
    start, end = step * np.pi, (step+1)*np.pi   # time range
    # use sin predicts cos
    steps = np.linspace(start, end, TIME_STEP, dtype=np.float32, endpoint=False)  # float32 for converting torch FloatTensor
    x_np = np.sin(steps)
    y_np = np.cos(steps)

    x = torch.from_numpy(x_np[np.newaxis, :, np.newaxis])    # shape (batch, time_step, input_size)
    y = torch.from_numpy(y_np[np.newaxis, :, np.newaxis])

    prediction, h_state = rnn(x, h_state)   # rnn output
    # !! next step is important !!
    h_state = h_state.data        # repack the hidden state, break the connection from last iteration

    loss = loss_func(prediction, y)         # calculate loss
    optimizer.zero_grad()                   # clear gradients for this training step
    loss.backward()                         # backpropagation, compute gradients
    optimizer.step()                        # apply gradients

    # plotting
    plt.plot(steps, y_np.flatten(), 'r-')
    plt.plot(steps, prediction.data.numpy().flatten(), 'b-')
    plt.draw(); plt.pause(0.05)

plt.ioff()
plt.show()