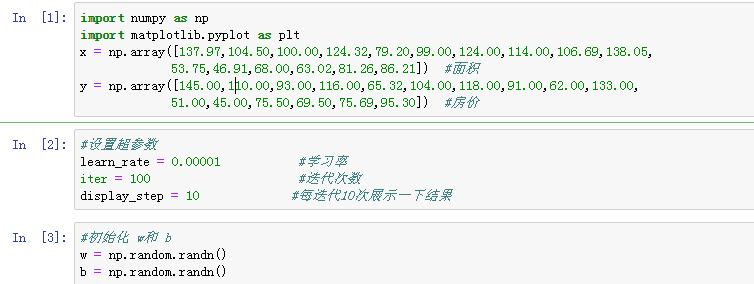
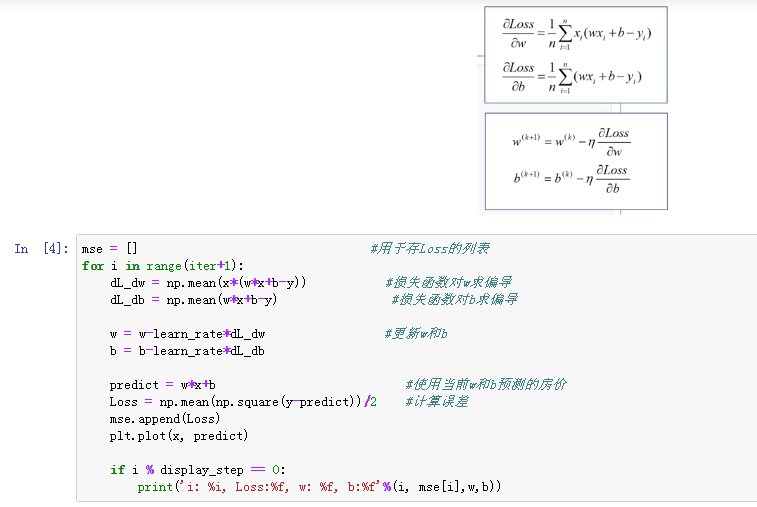


下面是一个梯度下降法对多元问题的求解:
 1 import numpy as np
 2 import matplotlib.pyplot as plt
 3 plt.rcParams['font.sans-serif'] = ['Simhei']
 4
 5 area = np.array([137.97,104.50,100.00,124.32,79.20,99.00,124.00,114.00,106.69,138.05,
 6              53.75,46.91,68.00,63.02,81.26,86.21])             #面积
 7 room = np.array([3,2,2,3,1,2,3,2,2,3,1,1,1,1,2,2])              #房间数
 8 price = np.array([145.00,110.00,93.00,116.00,65.32,104.00,118.00,91.00,62.00,133.00,
 9              51.00,45.00,75.50,69.50,75.69,95.30])              #房价
10 num = len(area)
11 x0 = np.ones(num)
12 x1 = (area - area.min())/(area.max() - area.min())           #对房间面积进行标准化
13 x2 = (room - room.min())/(room.max() - room.min())            #对房间数进行标准化
14
15 X = np.stack((x0,x1,x2), axis = 1)
16 Y = price.reshape(-1,1)
17
18 #设置超参数
19 learn_rate = 0.001
20 iter = 500
21 display_step = 50
22
23 #初始化w
24 np.random.seed(612)
25 W = np.random.randn(3,1)
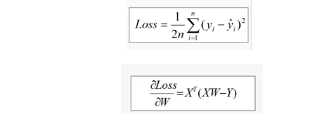
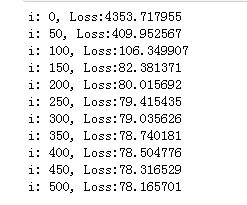
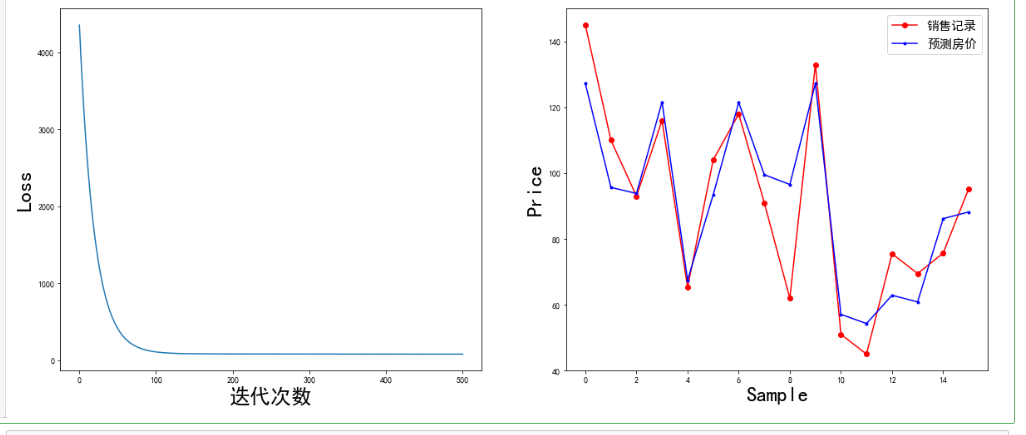
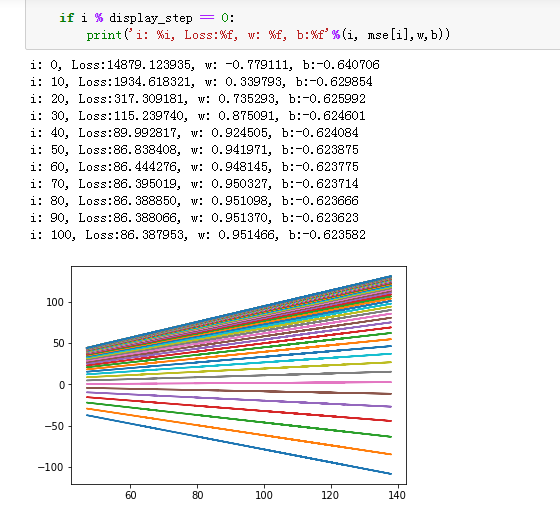
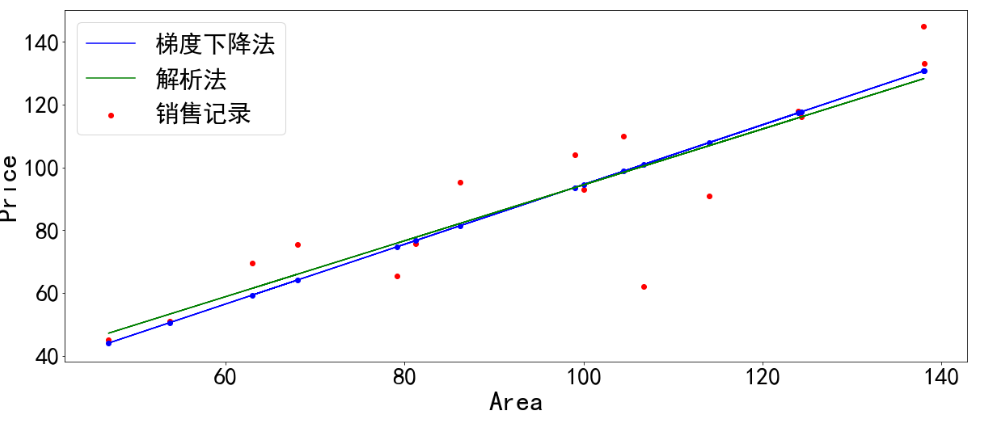
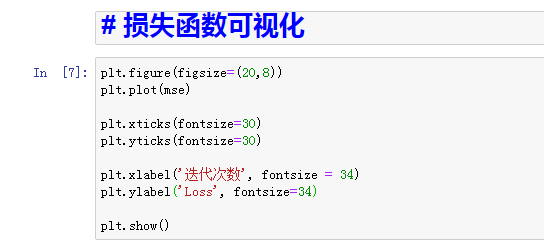
 1 #训练模型
 2 mse = []
 3 for i in range(iter+1):
 4     dL_dw = np.matmul(np.transpose(X),np.matmul(X,W)-Y)    #对W的偏导
 5     W = W-learn_rate*dL_dw                   #更新权值
 6
 7     PREDIC = np.matmul(X,W)                 #房价估计值
 8     Loss = np.mean(np.square(Y-PREDIC))/2
 9     mse.append(Loss)
10
11     if i % display_step ==0:
12         print('i: %i, Loss:%f'%(i,mse[i]))
13
14 #可视化结果
15 plt.figure(figsize=(20,8))
16
17 plt.subplot(1,2,1)
18 plt.plot(mse)
19 plt.xlabel('迭代次数', fontsize = 25)
20 plt.ylabel('Loss', fontsize = 25)
21
22 plt.subplot(1,2,2)
23 PREDIC = PREDIC.reshape(-1)
24 plt.plot(price,color = 'red', marker = 'o', label = '销售记录')
25 plt.plot(PREDIC, color = 'blue', marker = '.', label='预测房价')
26 plt.xlabel('Sample', fontsize = 25)
27 plt.ylabel('Price', fontsize=25)
28
29 plt.legend(fontsize=15)
30 plt.show()