import numpy as np
import matplotlib as mpl
mpl.rcParams["font.sans-serif"] = ["SimHei"]
import matplotlib.pyplot as plt
import pandas as pd

from sklearn.model_selection  import train_test_split
from sklearn.metrics import mean_squared_error

import xgboost as xgb
def notEmpty(s):
    return s != ''
names = ['CRIM','ZN', 'INDUS','CHAS','NOX','RM','AGE','DIS','RAD','TAX','PTRATIO','B','LSTAT']
path = "datas/boston_housing.data"
## 由于数据文件格式不统一,所以读取的时候,先按照一行一个字段属性读取数据,然后再按照每行数据进行处理
fd = pd.read_csv(path, header=None)
data = np.empty((len(fd), 14))
for i, d in enumerate(fd.values):
    d = map(float, filter(notEmpty, d[0].split(' ')))
    data[i] = list(d)

x, y = np.split(data, (13,), axis=1)
y = y.ravel()

print ("样本数据量:%d, 特征个数:%d" % x.shape)
print ("target样本数据量:%d" % y.shape[0])
样本数据量:506, 特征个数:13
target样本数据量:506
# 查看数据信息
X_DF = pd.DataFrame(x)
X_DF.info()
X_DF.describe().T
X_DF.head()
<class 'pandas.core.frame.DataFrame'>
RangeIndex: 506 entries, 0 to 505
Data columns (total 13 columns):
0     506 non-null float64
1     506 non-null float64
2     506 non-null float64
3     506 non-null float64
4     506 non-null float64
5     506 non-null float64
6     506 non-null float64
7     506 non-null float64
8     506 non-null float64
9     506 non-null float64
10    506 non-null float64
11    506 non-null float64
12    506 non-null float64
dtypes: float64(13)
memory usage: 51.5 KB

#数据的分割,
x_train, x_test, y_train, y_test = train_test_split(x, y, train_size=0.8, random_state=14)
print ("训练数据集样本数目:%d, 测试数据集样本数目:%d" % (x_train.shape[0], x_test.shape[0]))
训练数据集样本数目:404, 测试数据集样本数目:102
# XGBoost将数据转换为XGBoost可用的数据类型
dtrain = xgb.DMatrix(x_train, label=y_train)
dtest = xgb.DMatrix(x_test)
# XGBoost模型构建
# 1. 参数构建
params = {'max_depth':2, 'eta':1, 'silent':1, 'objective':'reg:linear'}
num_round = 2
# 2. 模型训练
bst = xgb.train(params, dtrain, num_round)
# 3. 模型保存
bst.save_model('xgb.model')
# XGBoost模型预测
y_pred = bst.predict(dtest)
print(mean_squared_error(y_test, y_pred))
24.869737956719252
# 4. 加载模型
bst2 = xgb.Booster()
bst2.load_model('xgb.model')
# 5 使用加载模型预测
y_pred2 = bst2.predict(dtest)
print(mean_squared_error(y_test, y_pred2))
24.869737956719252
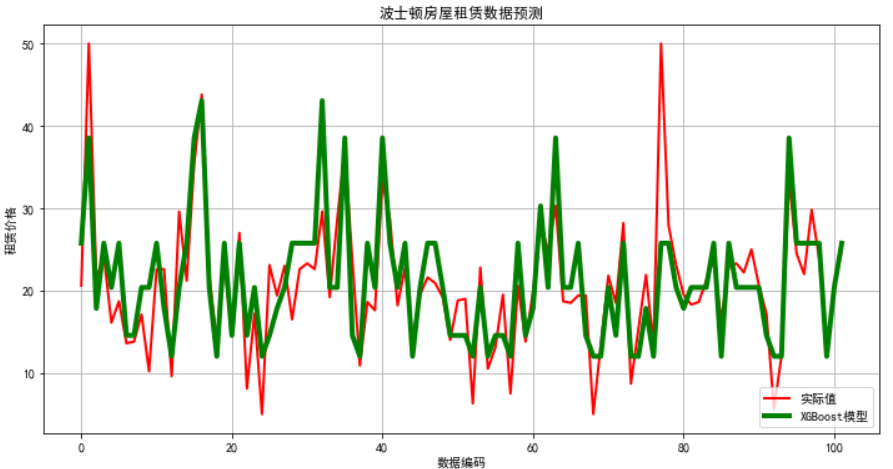
# 画图
## 7. 画图
plt.figure(figsize=(12,6), facecolor='w')
ln_x_test = range(len(x_test))

plt.plot(ln_x_test, y_test, 'r-', lw=2, label=u'实际值')
plt.plot(ln_x_test, y_pred, 'g-', lw=4, label=u'XGBoost模型')
plt.xlabel(u'数据编码')
plt.ylabel(u'租赁价格')
plt.legend(loc = 'lower right')
plt.grid(True)
plt.title(u'波士顿房屋租赁数据预测')
plt.show()
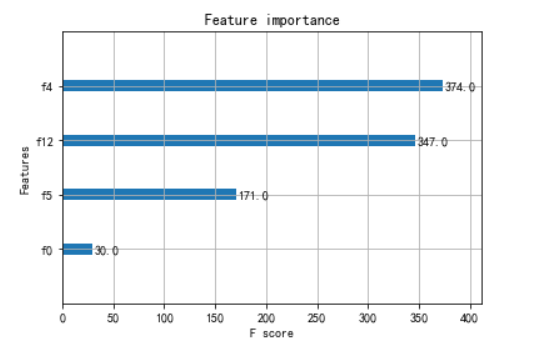
from xgboost import plot_importance
from matplotlib import pyplot
# 找出最重要的特征
plot_importance(bst,importance_type = 'cover')
pyplot.show()