前言
昨天开始接触卷积神经网络,copy了一个网络,其中用的数据集是MNIST数据集,我对于此很陌生,所以先查找了MNIST的相关资料,其中CSDN中有位博主写的特别详细,所以这边也参考他的博客并加入自己的理解,这篇博客更多的是作为个人的一个学习笔记。
参考博客:https://blog.csdn.net/simple_the_best/article/details/75267863
下载数据集
MNIST 数据集已经是一个被”嚼烂”了的数据集, 很多教程都会对它”下手”, 几乎成为一个 “典范”. 不过有些人可能对它还不是很了解, 下面来介绍一下.
MNIST 数据集可在 http://yann.lecun.com/exdb/mnist/ 获取。嗯,把官方说明看了几遍,大概对MNIST数据集有了个了解。

MNIST 数据集来自美国国家标准与技术研究所, National Institute of Standards and Technology (NIST). 训练集 (training set) 由来自 250 个不同人手写的数字构成, 其中 50% 是高中学生, 50% 来自人口普查局 (the Census Bureau) 的工作人员. 测试集(test set) 也是同样比例的手写数字数据.
可以新建一个文件夹 – mnist, 将数据集下载到 mnist 以后, 解压即可。
还有另一种下载方法,可以通过pytorch库安装相应的数据集MNSIT
# Mnist digits dataset
train_data = torchvision.datasets.MNIST(
    root='./mnist/',								# 下载到的地址
    train=True,                                     # 这里表明是训练数据
    download=True   				 			    # 设置download为true,表示要下载该数据集
读取到NumPy array 中
大家可以去看一下官方说明,其实和用汇编语言显示字符类似,字符的前景色、背景色、闪烁等这些都记录在属性字节中。而这里,下载的数据集图片也是以字节的形式进行存储, 所以我们需要把它们读取到 NumPy array 中, 以便训练和测试算法。
import os
import struct
import numpy as np

def load_mnist(path, kind='train'):
    """从地址 `path`中加载MNIST数据集"""
    labels_path = os.path.join(path,
                               '%s-labels-idx1-ubyte'
                               % kind)
    images_path = os.path.join(path,
                               '%s-images-idx3-ubyte'
                               % kind)
    with open(labels_path, 'rb') as lbpath:
        magic, n = struct.unpack('>II',
                                 lbpath.read(8))
        labels = np.fromfile(lbpath,
                             dtype=np.uint8)

    with open(images_path, 'rb') as imgpath:
        magic, num, rows, cols = struct.unpack('>IIII',
                                               imgpath.read(16))
        images = np.fromfile(imgpath,
                             dtype=np.uint8).reshape(len(labels), 784)

    return images, labels
load_mnist 函数返回两个数组, 第一个是一个 n x m 维的 NumPy array(images), 这里的 n 是样本数(行数), m 是特征数(列数). 训练数据集包含 60,000 个样本, 测试数据集包含 10,000 样本. 在 MNIST 数据集中的每张图片由 28 x 28 个像素点构成, 每个像素点用一个灰度值表示. 在这里, 我们将 28 x 28 的像素展开为一个一维的行向量, 这些行向量就是图片数组里的行(每行 784 个值, 或者说每行就是代表了一张图片). load_mnist 函数返回的第二个数组(labels) 包含了相应的目标变量, 也就是手写数字的类标签(整数 0-9)。
这里可能会对读取该数据集的方式有疑惑,
magic, n = struct.unpack('>II', lbpath.read(8))
labels = np.fromfile(lbpath, dtype=np.uint8)
为了理解这两行代码, 可以看一下 MNIST 网站上对数据集的介绍:

通过使用上面两行代码, 首先读入 magic number, 它是一个文件协议的描述, 也是在调用 fromfile 方法将字节读入 NumPy array 之前在文件缓冲中的 item 数(n). 作为参数值传入 struct.unpack 的 >II 有两个部分:
>:这是指大端(用来定义字节是如何存储的)I:这是指一个无符号整数.
(这里不太理解,先mark,参考博主的建议《深入理解计算机系统 – 2.1 节信息存储》,再学习这块知识)
可视化处理数据集MNIST
通过执行下面的代码, 程序将会从刚刚解压 MNIST 数据集后的 mnist 目录下加载 60,000 个训练样本和 10,000 个测试样本.
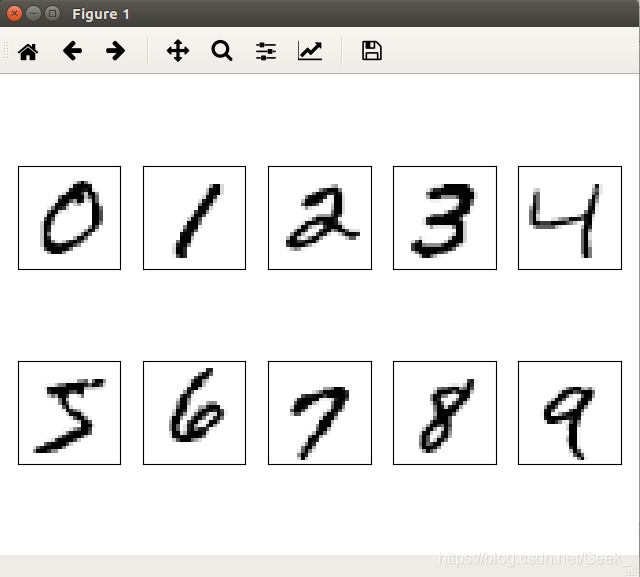
为了了解 MNIST 中的图片看起来到底是个啥, 对其进行可视化处理。从 feature matrix 中将 784-像素值 的向量 reshape 为之前的 28*28 的形状, 然后通过 matplotlib 的 imshow 函数进行绘制:
# refer to https://blog.csdn.net/simple_the_best/article/details/75267863
import matplotlib.pyplot as plt
import os
import struct
import numpy as np

def load_mnist(path, kind='train'):
    """从地址 `path`中加载MNIST数据集"""
    labels_path = os.path.join(path,
                               '%s-labels-idx1-ubyte'
                               % kind)
    images_path = os.path.join(path,
                               '%s-images-idx3-ubyte'
                               % kind)
    with open(labels_path, 'rb') as lbpath:
        magic, n = struct.unpack('>II',
                                 lbpath.read(8))
        labels = np.fromfile(lbpath,
                             dtype=np.uint8)

    with open(images_path, 'rb') as imgpath:
        magic, num, rows, cols = struct.unpack('>IIII',
                                               imgpath.read(16))
        images = np.fromfile(imgpath,
                             dtype=np.uint8).reshape(len(labels), 784)

    return images, labels

X_train,y_train = load_mnist('mnist/MNIST/raw/') # 调用load_mnist函数,这里用的是相对地址
fig, ax = plt.subplots(
    nrows=2,
    ncols=5,
    sharex=True,
    sharey=True, )

ax = ax.flatten()
for i in range(10):
    img = X_train[y_train == i][0].reshape(28, 28)
    ax[i].imshow(img, cmap='Greys', interpolation='nearest')

ax[0].set_xticks([])
ax[0].set_yticks([])
plt.tight_layout()
plt.show()
输出
现在应该可以看到一个 2*5 的图片, 里面分别是 0-9 单个数字的图片.
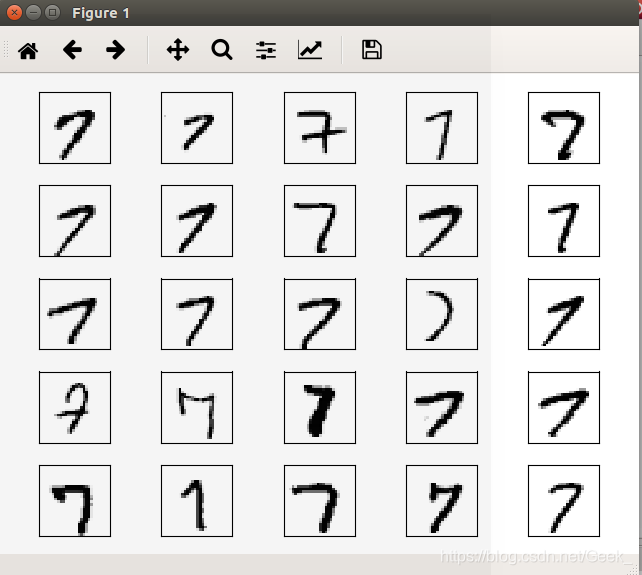
显示不同样本的数字
fig, ax = plt.subplots(
    nrows=5,
    ncols=5,
    sharex=True,
    sharey=True, )

ax = ax.flatten()
for i in range(25):
    img = X_train[y_train == 5][i].reshape(28, 28) 	# 可以显示不同样本图片‘5’
    ax[i].imshow(img, cmap='Greys', interpolation='neare不st')

ax[0].set_xticks([])
ax[0].set_yticks([])
plt.tight_layout()
plt.show()
还可以绘制某一数字的多个样本图片, 来看一下这些手写样本到底有多不同:

另外, 该博主还有下载CSV版本的MNIST数据集,因为我还没实践,所以在这就先不写了。
