- 线性回归
回归模型如下:

其中θ是我们需要优化的参数,x是n+1维的特征向量,给定一个训练集,我们的目标是找出θ的最佳值,使得目标函数J(θ)最小化:

优化方法之一是梯度下降算法。算法迭代执行,并在每次迭代中,我们更新θ遵循以下准则

其中α是学习率,通过梯度下降的方式,使得损失函数最小,求得最合适的θ值。
- 2D线性回归
题目是一个测量身高的例子,对象基于两岁到八岁之间的男孩。y值是以米为单位测量的高度,x值是对应于高度的男孩年龄。有m = 50的训练例子,您将使用它们来开发使用梯度下降算法的线性回归模型,基于此,我们可以预测给定新年龄值的高度。
- 首先,加载数据集;
![]()
得到两个50x1的列向量。
- 绘制图像:
使用以下代码绘制图像:
得到结果:

而我们要做的工作就是,根据数据集,得到一个高度关于年龄的函数,能够最大程度匹配数据集中的样本,
- 因为我们在设计线性回归算法的时候,想要把常数项合并,得到一个矩阵相乘的形式,所以我们需要将矩阵x做一些变化。
![]()
得到新的x是一个50x2的矩阵。
- 题目中给出学习率为0.07,此处,首先设置迭代次数为1500,根据输出结果,发现,当迭代次数达到1000时,损失函数已经收敛,因此,修正迭代次数为1000我们设计线性回归算法如下:

其中theta是需要优化的参数,step表示迭代次数,sqrerrors指代真实值和预测值之间的距离的平方,Jcost是损失函数。
- 程序运行之后,作图如下:
1) 损失函数的值与迭代次数之间的关系

2) 根据训练集做线性回归得到的函数结果:

θ=[0.7502,0.0639],即函数为y=0.0639x+0.7502.
横坐标为年龄,纵坐标为身高,其中两个X号表示当年龄为3.5 和 7岁时所预测的身高值。
- 理解梯度下降:
运行代码如下:
绘制曲面如下:

MATLAB 源代码
clc,clear
x = load ('ex1x.dat ') ;
y = load ('ex1y.dat') ;
figure % open a new figure window
plot (x , y , 'o' ) ;
ylabel ( ' Height in meters ' )
xlabel ( 'Age in years ' )
添加theta=1的那一列
m = length (y) ; % store the number of training examples
x =[ones(m,1) , x] % Add a column of ones to x
J_vals = zeros (100 , 100) ; % initialize Jvals to
% 100*100 matrix of 0's
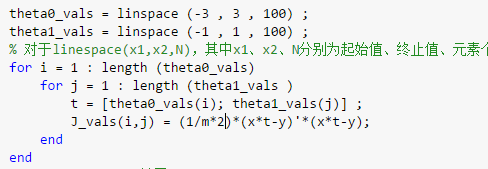
theta0_vals = linspace (-3 , 3 , 100) ;
theta1_vals = linspace (-1 , 1 , 100) ;
% 对于linespace(x1,x2,N),其中x1、x2、N分别为起始值、终止值、元素个数。
for i = 1 : length (theta0_vals)
for j = 1 : length (theta1_vals )
t = [theta0_vals(i); theta1_vals(j)] ;
J_vals(i,j) = (1/m*2)*(x*t-y)'*(x*t-y);
end
end
J_vals=J_vals'; %转置
figure ;
surf(theta0_vals,theta1_vals,J_vals);
xlabel ('\theta_0 ');ylabel('\theta_1');
学习率0.07
learning_rate=0.07;
iteration=1500;
theta=[0,0]
for step=1:iteration
temp=x*theta'-y;
sqrerrors=temp.^2;
theta=theta-learning_rate*(1/m)*(temp'*x);
Jcost(step) = (1/2*m)*sum(sqrerrors);
disp(step),disp(Jcost(step))
end
figure;
plot(Jcost)
title('The relation between J and iteration ');
ylabel ( 'J' )
xlabel ( 'iteration' )
legend('\alpha = 0.07')
figure
plot (x(:,2) , y , ' o ' ) ;
hold on
plot(x(:,2), x*theta', '-');
hold on
plot(3.5,[1,3.5]*theta','x','Color','r')
plot(7,[1,7]*theta','x','Color','r')
xlabel('Age in years')
ylabel('Height in meter s ')
legend('Training Data','Linear Regression','Prediction1&2')
title('Training Result')
