Echarts 简单报表系列四:雷达图

代码如下:

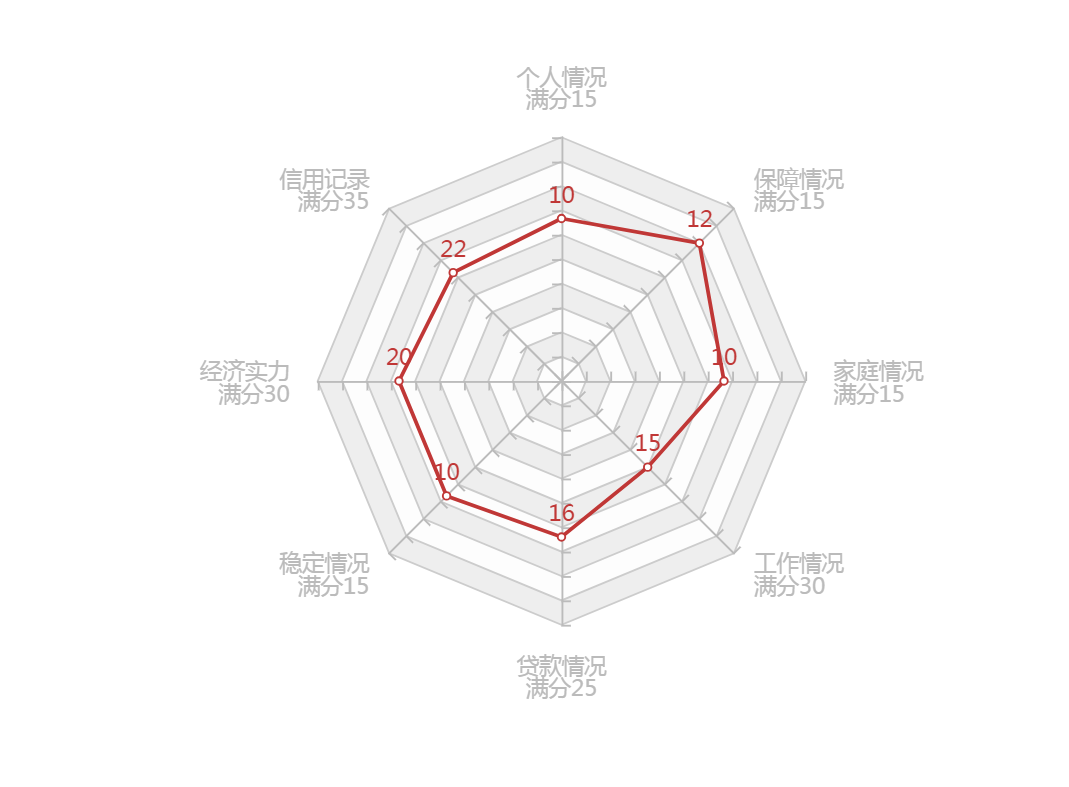
<!DOCTYPE html>
<html lang="en">
<head>
    <meta charset="UTF-8">
    <title>Document</title>
</head>
<body>
  <!-- 为ECharts准备一个具备大小(宽高)的Dom -->
    <div id="main" style="width: 600px;height:400px;"></div>
    <!-- 引入echarts.js -->
    <script src="https://cdn.bootcss.com/echarts/4.0.2/echarts.js"></script>
    <script>
    //获取容器的id并赋值给变量myChart
    var myChart = echarts.init(document.getElementById('main'));
    /*用来配置参数*/
    var option = {
             radar :{
                        indicator : [
                            {text : '个人情况\n满分15', max  : 15},
                            {text : '信用记录\n满分35', max  : 35},
                            {text : '经济实力\n满分30', max  : 30},
                            {text : '稳定情况\n满分15', max  : 15},
                            {text : '贷款情况\n满分25', max  : 25},
                            {text : '工作情况\n满分30', max  : 30},
                            {text : '家庭情况\n满分15', max  : 15},
                            {text : '保障情况\n满分15', max  : 15}
                            
                        ],
                        radius : 130,
                        splitNumber : 10,
                        axisTick : {
                            show : true
                        }
                    }
                ,
             series : 
                    {
                        type: 'radar',
                        data : [
                            {
                                value : [10,22,20,10,16,15,10,12,15],
                                label: {
                                    normal: {
                                        show: true
                                    }
                                }
                            }
                        ]
                    }
            };
     /*调用option生成图表*/
    myChart.setOption(option)
    </script>
</body>
</html>

显示效果:

猜你喜欢

转载自www.cnblogs.com/huanghongbo/p/9060150.html