霍夫变换是一种在图像中寻找直线,圆形以及其他简单形状的方法,采用类似于投票的方法来获取图像内的形状集合
通过笛卡尔坐标系来简单说明霍夫变换
在笛卡尔x-y坐标系(笛卡尔空间)中有一条直线 y = k0 * x +b0 则在霍夫k-b坐标系(霍夫空间)中找到映射的点( k0 , b0 )
同样在笛卡尔空间中由一点( x0 , y0 ) , 在霍夫空间中映射为一条支线 b = -x0 * k + y0
若在笛卡尔空间中有两个点 (x1 , y1) , (x2 , y2) 并且连成一条支线 y = k0 * x + b0
映射在霍夫空间为两条直线b = -x1 * k + y1 ,b = -x2 * k + y2 和点( k0 , b0 ), 该两条直线相交于点 ( k0 , b0 )
(那我猜想若将笛卡尔空间中的一条支线上的所有点映射在霍夫空间的这些直线则 会形成一个圆)
在笛卡尔空间可能存在x = x0的直线此时k无穷大,截距无法取值,因此无法映射到霍夫空间,
可以将笛卡尔坐标系映射到极坐标系上
极坐标系中采用极径r 和极角θ , r为原点到直线的垂直距离, 而θ为原点到直线的垂线 与x轴的夹角
霍夫变换选择直线的基本思路为:在霍夫空间中尽可能选择多条线汇成的点
函数形式
lines = cv2.HoughLines( image , rho , theta , threshold )
lines 其中每个元素都是浮点数,表示检测到直线的参数,(r,θ) 是numpy.ndarray 类型
image 即输入图像,必须是8位单通道二值图像,若是其他类型的图像,必须在霍夫变换之前,需要转换为指定格式
rho以像素位单位的距离r的精度,一般情况下, 精度为1
theta以角度θ为精度, 一般情况下使用精度是π/180,表示搜索所有可能的角度
threshold阈值该值越小判断的直线就越多,
因为该函数检测的是直线而不是线段,所以检测的直线时没有端点的,
 1 import cv2
 2 import numpy as np
 3 import matplotlib.pyplot as plt
 4 img = cv2.imread("mc.jpg")
 5 gray = cv2.cvtColor(img , cv2.COLOR_BGR2GRAY)
 6 edges = cv2.Canny(gray , 50 ,150 ,apertureSize = 3)
 7 orgb = cv2.cvtColor(img , cv2.COLOR_BGR2RGB)
 8 oShow = orgb.copy()
 9 lines = cv2.HoughLines(edges , 1 , np.pi/180 , 140)
10 for line in lines:
11     rho , theta = line[0]
12     a = np.cos(theta)
13     b = np.sin(theta)
14     x0 = a*rho
15     y0 = b*rho
16     x1 = int(x0 + 1000*(-b))
17     y1 = int(y0 + 1000*(a))
18     x2 = int(x0 - 1000*(-b))
19     y2 = int(y0 - 1000*(a))
20     cv2.line(orgb , (x1 , y1) , (x2,y2) , (0,0,255) , 2)
21 plt.subplot(121)
22 plt.imshow(oShow)
23 plt.axis('off')
24 plt.subplot(122)
25 plt.imshow(orgb)
26 plt.axis('off')
27 plt.show()
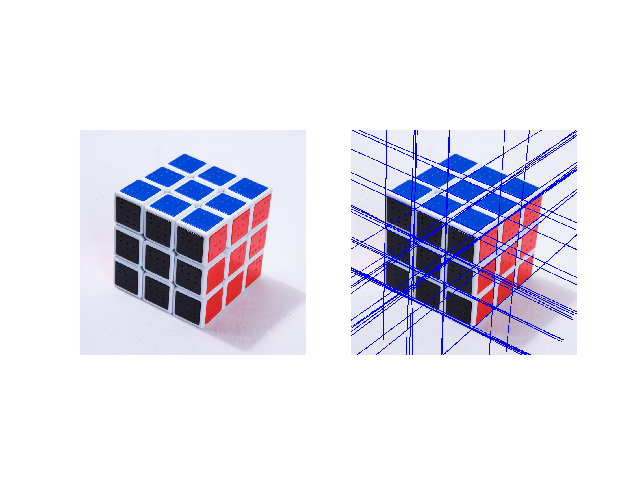
可以看出其中有很多重复的直线, 是因为检测出了重复的结果
使用霍夫变换 可能碰巧有限个点对齐的非直线关系, 被检测为直线,而导致误检测
概率霍夫变换对基本霍夫变换算法进行了修正,其没有考虑所有的点,对选取直线有两点改进
1,所接受直线的最小长度,如果超过阈值个数的像素点构成了一条直线,但是这条直线,长度很短,
那么就不会判定为直线,这就避免因为若干像素碰巧连成直线的误检测
2.接受直线时所允许最大像素点间距,如果超过阈值个数的像素点构成了直线,但是这组像素点之间的距离都很远,
就不会接受,该直线为判断结果
函数形式
lines = cv2.HoughLinesP( image , rho , theta , threshold , minLineLength , maxLineGap )
minLineLength即直线的最小长度, 默认值为0
maxLineGap 即像素点的最小间隔, 默认值为0
其他值与基本霍夫变换一致
 1 import cv2
 2 import numpy as np
 3 import matplotlib.pyplot as plt
 4 img = cv2.imread("mc.jpg" , -1)
 5 gray = cv2.cvtColor(img , cv2.COLOR_BGR2GRAY)
 6 edges = cv2.Canny(gray , 50 ,150 , apertureSize = 3)
 7 orgb = cv2.cvtColor( img , cv2.COLOR_BGR2RGB)
 8 oShow = orgb.copy()
 9 lines = cv2.HoughLinesP(edges , 1 ,np.pi/180 ,1, minLineLength = 40 ,
10         maxLineGap = 10)
11 for line in lines:
12     x1,y1,x2,y2 = line[0]
13     cv2.line(orgb , (x1,y1) , (x2,y2) ,(255,0,0), 5)
14 plt.subplot(121)
15 plt.imshow(oShow)
16 plt.axis('off')
17 plt.subplot(122)
18 plt.imshow(orgb)
19 plt.axis('off')
20 plt.show()

 1 import cv2
 2 import numpy as np
 3 import matplotlib.pyplot as plt
 4 img = cv2.imread("chess.jpg", 0)
 5 imgo = cv2.imread("chess.jpg" , -1)
 6 o = cv2.cvtColor(imgo , cv2.COLOR_BGR2RGB)
 7 oshow = o.copy()
 8 img = cv2.medianBlur(img,5)
 9 circles = cv2.HoughCircles(img, cv2.HOUGH_GRADIENT,1,300,param1 = 50
10         ,param2 = 30 , minRadius = 100 , maxRadius = 200)
11 circles = np.uint16(np.around(circles))
12 for i in circles[0,:]:
13     cv2.circle(o , (i[0] , i[1]), i[2] , (255,0,0) , 12)
14     cv2.circle(o , (i[0] , i[1]), 2 , (255,0,0) , 12)
15 plt.subplot(121)
16 plt.imshow(oshow)
17 plt.axis('off')
18 plt.subplot(122)
19 plt.imshow(o)
20 plt.axis('off')
21 plt.show()
