Angularjs使用echarts关系图

将echarts散点图转换为关系图

因为数据显示的问题,需要在散点图中使用关系图的数据

前景提要

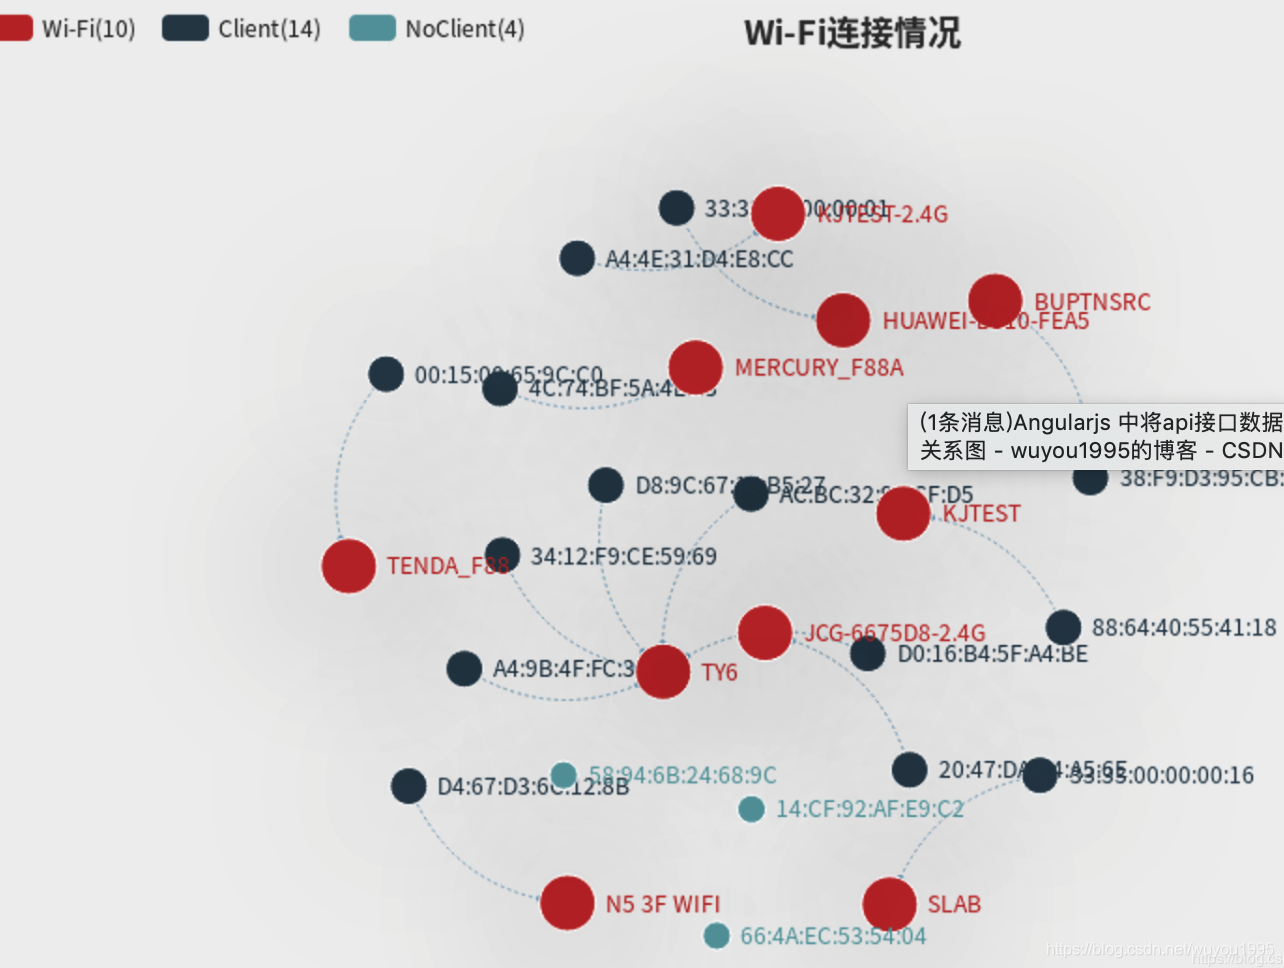
最近在做一个安全工具的集成,需要把周围扫描的Wi-Fi连接信息显示在界面上,做成类似于星系图的样子,Wi-Fi节点根据信号强度实现与图中心的远近。之前是这样的
在这里插入图片描述
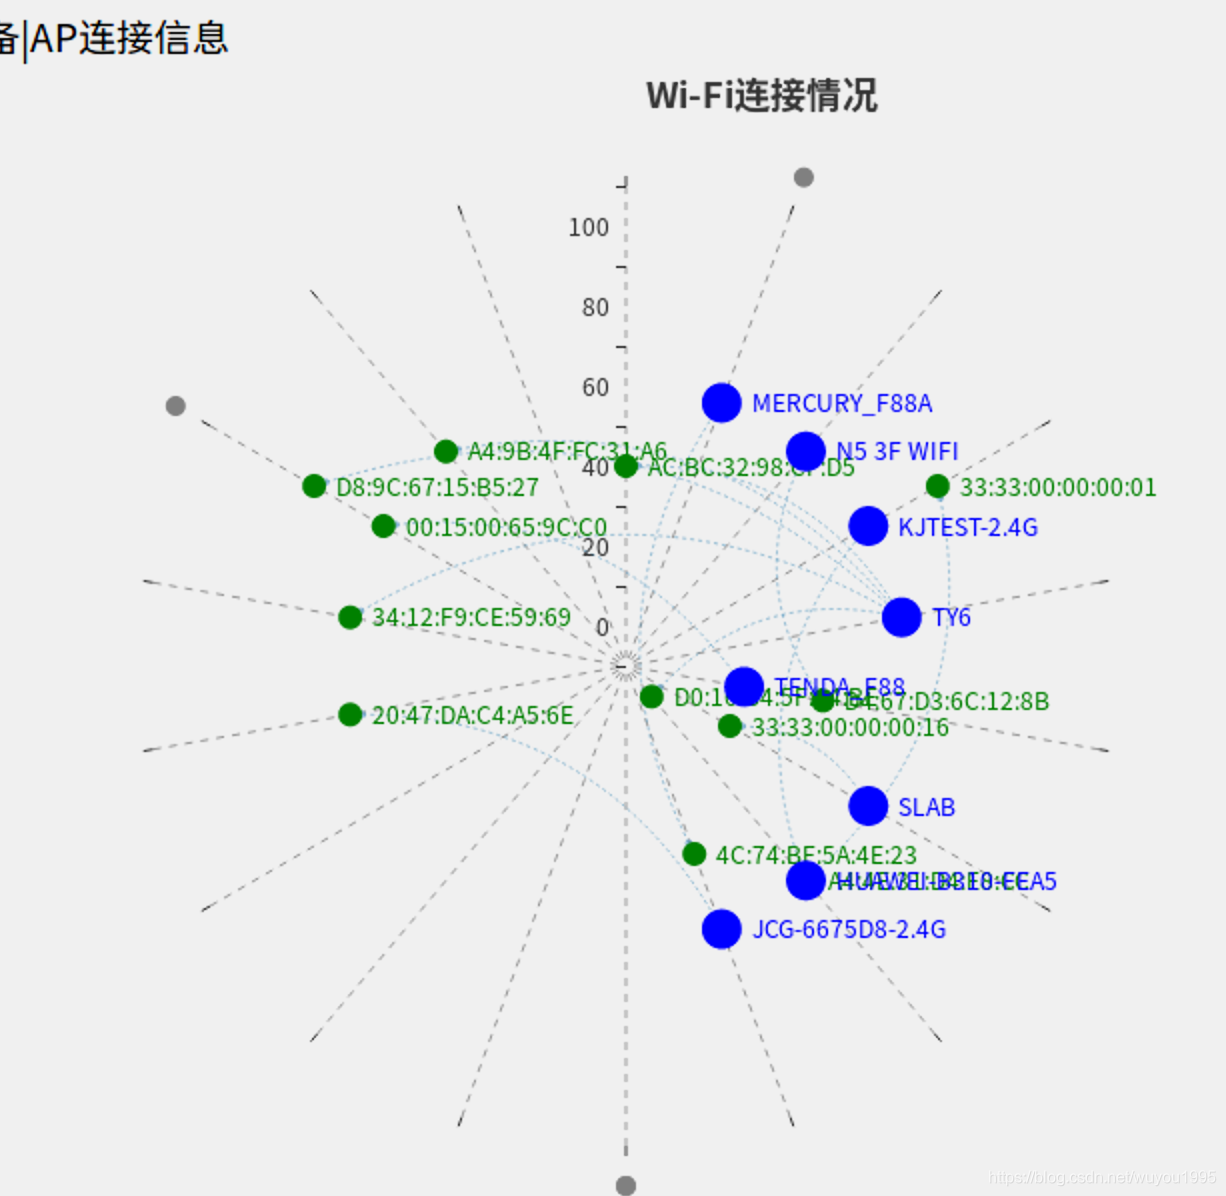
于是我在echarts 中找了一下,并没有我想要的类似,但是发现了一种散点图。可以根据这个散点图来进行更改,达到我要的效果。
在这里插入图片描述
然后我的数据是这样的,AP是指Wi-Fi的MAC地址,Ap_name代表Wi-Fi的名称,AClient代表连接Wi-Fi的手机或者设备。
在这里插入图片描述

Begin

先导入需要的包

<script src="https://cdn.bootcss.com/echarts/4.3.0-rc.2/echarts-en.min.js"></script>

前端界面

<div ng-controller="echarts11">
    <div style="margin-left:30px;font-size: 19px;">|AP设备|AP连接信息</div>
    <div hello-echartss id="echartstest" style="width: 800px;height:600px;"></div></div>

接下来就是angularjs中整个修改echarts 后的代码,话不多说,直接上代码


app.controller('echarts11',function ($rootScope,$scope,$http,) {
}).directive('helloEchartss',function () {
    return{
        restrict:'AE',
        template:'<div>Wi-Fi连接信息</div>',
        controller:function ($scope,$http) {
                $http({
                method:'GET',
                url:'http://127.0.0.1:5000/Ainfo', //从接口中拿数据
                xhrFields: {withCredentials: true},
            }).then(function successCallback (response) {
                    $scope.Ainfotable=response.data.Ainfo;
                    $scope.Binfotable = response.data.Binfo;
                    $scope.notAStation = response.data.notAStation;
                      // 随机数
                    var random = function (max){
                        return (Math.random() * max).toFixed(3);
                    };
                    // 连接Wi-Fi设备的手机或者设备节点
                    var info=$scope.Ainfotable;
                    //Wi-Fi 节点
                    var info1 = $scope.Binfotable;
                    //没有连接Wi-Fi的节点
                    var info2 = $scope.notAStation;
                    nodes=[]; 
                    links=[];
                    nodes1=[];
                    nodes2=[];
                    nodes3=[];
                    // 生成连接Wi-Fi设备的手机或者设备节点
                    //节点的格式[hours,rssi,点的大小,点的颜色标识位]
                    for(let i=0;i<info.length;i++){
                    //console.log(info[i].Ap_name+i);
                        nodemessage=[];
                        nodemessage.push(parseInt(random(5))); //信号强度rssi   0
                        nodemessage.push(parseInt(random(18))); // hours  1
                        nodemessage.push(6); //点的大小                 2
                        nodemessage.push(2); //点颜色的标志位            3
                        nodemessage.push(info[i].AClient);
                        nodemessage.push(info[i].AClient); //         5
                        nodemessage.push(info[i].Ap_name); // 连接的Ap的名字 6
                        nodes1.push(nodemessage)
                    }
                    //console.log(nodes1);
                    // 生成Ap 节点
                    var i= 1;
                    for(var k=0;k<info1.length;k++){
                        nodemessage2 = [];

                        // 信号强度
                        if(info1[k].rssi <20){
                            nodemessage2.push(0); //信号强度   0
                        }else if(info1[k].rssi >=20 && info1[k].rssi <40 ){
                             nodemessage2.push(1); //信号强度   0
                        }else if(info1[k].rssi >=40 && info1[k].rssi <60 ){
                             nodemessage2.push(2); //信号强度   0
                        }else if(info1[k].rssi >=60 && info1[k].rssi <80 ){
                             nodemessage2.push(3); //信号强度   0
                        }else if(info1[k].rssi >=80 && info1[k].rssi <100 ){
                             nodemessage2.push(4); //信号强度   0
                        }else if(info1[k].rssi >=100){
                              nodemessage2.push(5); //信号强度   0
                        }
                        if (i>18){
                            i = 0
                        }
                        nodemessage2.push(i); //hours  1
                        i = i+1;
                        nodemessage2.push(10); //点的大小                 2
                        nodemessage2.push(1); //点颜色的标志位            3
                        nodemessage2.push(info1[k].Ap);   //         4
                        nodemessage2.push(info1[k].Ap_name); // 连接的Ap的名字  5
                        nodes2.push(nodemessage2);
                    }
                   // console.log(nodes2);
                    // 没有连接Ap的设备
                    for(var p=0;p<info2.length;p++){
                        nodemessage3 =[];
                        nodemessage3.push(6);  //
                        nodemessage3.push(parseInt(random(18)));
                        nodemessage3.push(5);
                        nodemessage3.push(0);
                        nodemessage3.push(info2[p].mac);
                        nodemessage3.push();
                        nodes3.push(nodemessage3);
                    }
                    // 所有的节点
                    nodes=[...nodes1,...nodes2,...nodes3];
                    // Wi-Fi节点和连接了Wi-Fi的手机节点
                    nodes23 = [...nodes1,...nodes2];
                    // 生成Wi-Fi节点和手机节点的连接线,nodes1 是 手机节点(手机节点的下标作为source)
                    //, nodes23作为Wi-Fi节点(w下标作为target)
                    for(var j=0;j<nodes1.length;j++){
                        for (var w = info.length;w<nodes23.length;w++){
                           // console.log(nodes1[j][5]);
                            if (nodes1[j][6] == nodes23[w][5]){
                               // console.log(j,w,nodes23[w][5]);
                                link1 ={ "source": 0,"target":0};
                                link1.source = j;
                                link1.target = w;
                            }
                        }
                       // link1={"source":info[j].Ap_name, "target":info[j].AClient};
                        links.push(link1);
                    }
                    console.log(links);
                    //  hours 类似于是把圆分为好多块,类似于切披萨,
                    //切成很多块,这里且为18份,从圆心出发,往外面的直线
                    var hours = ['', '', '', '', '', '', '',
                        '', '', '', '', '',
                        '', '', '', '', '', ''];
                        // 表示围绕中心一层一层的圆,类似于年轮,一轮一轮的圆
                    var rssi = [0, 20, 40, 60,
                        80, 100];
                        // 通过hours 和rssi 可以确定一个点的位置,可以想象
                        //成直角坐标系中的X和Y。上面生成节点中[hours,rssi,点的大小,点的颜色标识位]
                    var myChart = echarts.init(document.getElementById('echartstest')); //初始化
                    option = {
                        title: {
                             text: 'Wi-Fi连接情况',
                           // subtext: 'Default layout',
                            top: 'top',
                            left: 'middle'
                        },
                        legend: {
                            data: ['Punch Card'],
                            left: 'right'
                        },
                        polar: {},
                        tooltip: { //提示框
                            formatter: function (params) {
                                return params.value[5];
                            }
                        },
                        //轴线 hour
                        angleAxis: { 
                            type: 'category',
                            data: hours,
                            boundaryGap: false,
                            splitLine: {
                                show: true,
                                lineStyle: {
                                    color: '#999',
                                    type: 'dashed'
                                }
                            },
                            axisLine: {
                                show: false
                            }
                        },
                        //横切 rssi
                        radiusAxis: {
                            type: 'category',
                            data: rssi,
                            axisLine: {
                                show: false
                            },
                            axisLabel: {
                               // rotate: 45
                            }
                        },
                        series: [{
                            name: '',
                            type: 'graph',
                            coordinateSystem: 'polar',
                            roam:'true',
                            focusNodeAdjacency:true,
                            animation: false,
                            legendHoverLink:true,
                            edgeSymbol: ['circle'],
                            edgeSymbolSize: [4],
                            ribbonType:false,
                            // 点的大小
                            symbolSize: function (val) {
                                return val[2] * 2;
                            },
                            // 节点的颜色
                            itemStyle:{
                                normal:{
                                    color:function (params) {
                                        if (params.value[3] ==1){
                                            return 'blue'
                                        }else if(params.value[3] ==2){
                                            return 'green'
                                        }else {
                                            return 'gray'
                                        }
                                    }
                                }
                            },
                            label: {
                                normal: {
                                    show:true,
                                    position: 'right',
                                    formatter: function (params) {
                                  return params.value[5];
                                     }
                                },

                            },
                            emphasis:{
                              lineStyle:{
                                  width:10
                              }
                            },
                            edgeLabel: {
                            normal: {
                                        textStyle: {
                                            fontSize: 20
                                         }
                                    }
                            },
                            lineStyle:{
                                color:'#438eb9',
                                curveness:0.3,
                                type:'curve'

                            },
                            links:links,  // 节点之间的连线
                            data: nodes,  //所有的节点
                            animationDelay: function (idx) {
                            return idx * 5;
                             }
                        }]
                    };
                    myChart.setOption(option);
                });
          },
    }
});

代码里的注释都写的很详细了。不明白的属性可以查一查属性的设置。
这里直接上改完后的图
在这里插入图片描述
其实人跟树是一样的,越是向往高处的阳光,它的根就越要伸向黑暗的地底

发布了17 篇原创文章 · 获赞 15 · 访问量 1377

猜你喜欢

转载自blog.csdn.net/wuyou1995/article/details/102730762