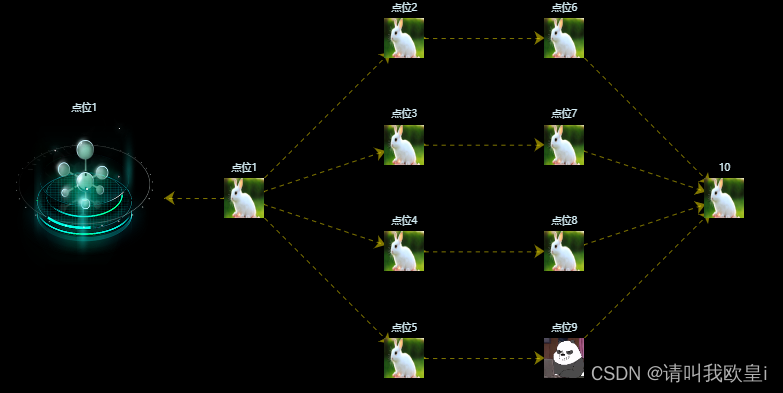
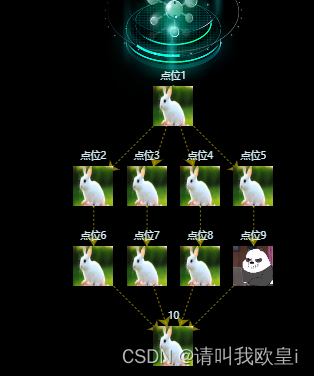
Echarts实现流程图关系图拓扑图

实现如下,可以横着排竖着排都可以


 1.先写个div做画布

ref值随意,但是一点要写

  <div style="height: 400px;" ref="echartdom"></div>

2.下载echarts

我这边下载的是 "echarts": "^4.9.0",最新版应该也可以实现这个

npm install echarts

3.主要代码如下

1.id为唯一值,也是links下的source和target线头指向目标,如果name就是1,2,3的话可以删掉id值,这样就有点名也可以连线了

2.name就是点的名字

3.type用来判断用哪张图片

4.data=[[],[],[]],这个是层级,第一个[]就是第一层

5.link顾名思义,用来连线的

6.图片引入方面我写了三种引入方式,根据自己项目来,image://固定别删

扫描二维码关注公众号,回复: 15723370 查看本文章
import echarts from 'echarts';
export default {
    data() {
        return {
        };
    },
    mounted() {
        this.echarsquery();
    },
    methods: {
        echarsquery() {
            const echart = echarts.init(this.$refs.echartdom);
            let data = [
                [{ id: '分析指标',name:"点位1", type: '0' }],
                [{ id: '1', name:"点位1",type: '0' }],
                [
                    { id: '2', name:"点位2", type: '0' },
                    { id: '3', name:"点位3", type: '0' },
                    { id: '4', name:"点位4", type: '0' },
                    { id: '5', name:"点位5", type: '0' }
                ],
                [
                    { id: '6', name:"点位6", type: '0' },

                    { id: '7', name:"点位7", type: '0' },
                    { id: '8', name:"点位8", type: '0' },
                    { id: '9', name:"点位9", type: '1' }
                ],
                [{ name: '10', type: '0' }]
            ];
            let l = 5;
            let series = [];
            data.forEach((item, i) => {
                const s = item.length; // segment 段数
                const base = Math.round((l * 100) / (s + 1));//值越小画布越宽,线越长
                item.forEach((item1, j) => {
                    item1.x = base * (j + 1);//水平还是垂直排列只需要把xy的顺序切换就行
                    item1.y = 100 + 150 * i;
                    if (i == 0) {
                        item1.symbolSize = 160;
                    }
                    series.push(item1);
                });
            });
            console.log(series, '段数');
            let option = {
                backgroundColor: '#000',//画布背景颜色
                grid: {
                    top:20,
                    containLabel: true
                },
                series: [
                    {
                        type: 'graph',
                        layout: 'none',
                        symbolSize: 40,
                        symbol: (v, params) => {
                            // 根据type判断图片
                            if (params.data.type == 1) {
                                return `image://${require('@/assets/img/img.jpg')}`; 
                            }
                            if (params.dataIndex) {
                                return "image://https://ts1.cn.mm.bing.net/th/id/R-C.8d3bd79b3c79c29c28b77d95dc949a20?rik=CItp4J1WJ6zj%2fA&riu=http%3a%2f%2fb157.photo.store.qq.com%2fpsb%3f%2f0cfe0398-1051-44f5-ba2e-d27742b52ab5%2fRKDHie6uwkitUT7FIf2QzqPjG9Bper2nreXpvaMZwiU!%2fb%2fdA2To12oGQAA%26bo%3dWAKQAe0!%26su%3d0267982465%26rf%3d2-9&ehk=tuB%2bS5A0mAkWrAMiP6tavVwtLw2s0bCNvNmxGcwVqUM%3d&risl=&pid=ImgRaw&r=0";
                            } else {
                                return `image://${this.first}`;//base64编码png图片,太长了就不展示了
                            }
                        },
                        roam: false,
                        lineStyle: {
                            color: '#ffeb00',
                            type: 'dashed', //虚线
                            dashOffset: 5
                        },
                        label: {
                            normal: {
                                show: true,
                                position: 'top', //'inside',
                                textStyle: {
                                    fontSize: 10,
                                    color: '#d3ecf3'
                                    // padding:[-20, 0, 20, 0]
                                }
                            }
                        },
                        focusNodeAdjacency: true,
                        edgeSymbol: ['', 'arrow'],
                        edgeSymbol: ['circle', 'arrow'],
                        edgeSymbolSize: [2, 10], //箭头的大小
                        data: series,
                        links: [
                            {
                                source: '1', //点位
                                target: '分析指标' //箭头指向目标
                            },
                            {
                                source: '1', //点位
                                target: '2' //目标
                            },
                            {
                                source: '1', //点位
                                target: '3' //目标
                            },
                            {
                                source: '1', //点位
                                target: '4' //目标
                            },
                            {
                                source: '1', //点位
                                target: '5' //目标
                            },
                            {
                                source: '2', //点位
                                target: '6' //目标
                            },
                            {
                                source: '3', //点位
                                target: '7' //目标
                            },
                            {
                                source: '4', //点位
                                target: '8' //目标
                            },
                            {
                                source: '5', //点位
                                target: '9' //目标
                            },
                            {
                                source: '6', //点位
                                target: '10' //目标
                            },
                            {
                                source: '7', //点位
                                target: '10' //目标
                            },
                            {
                                source: '8', //点位
                                target: '10' //目标
                            },
                            {
                                source: '9', //点位
                                target: '10' //目标
                            },
                        ]
                    }
                ]
            };
            echart.setOption(option);
        }
}}

文章到此结束,希望对你有所帮助~

猜你喜欢

转载自blog.csdn.net/qq_44278289/article/details/131331108