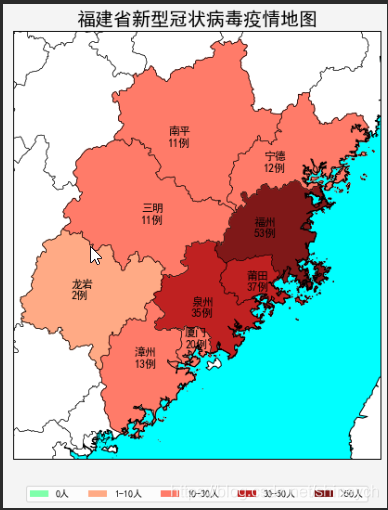
运行结果(2020-2-4日数据,福建省)
数据爬取
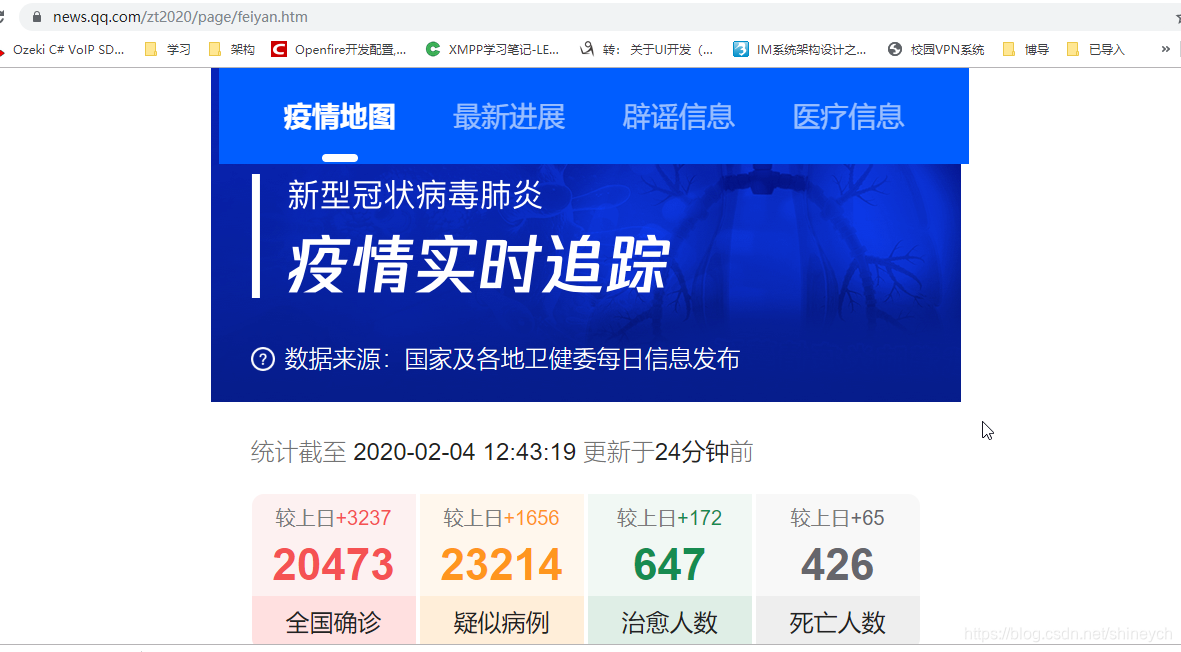
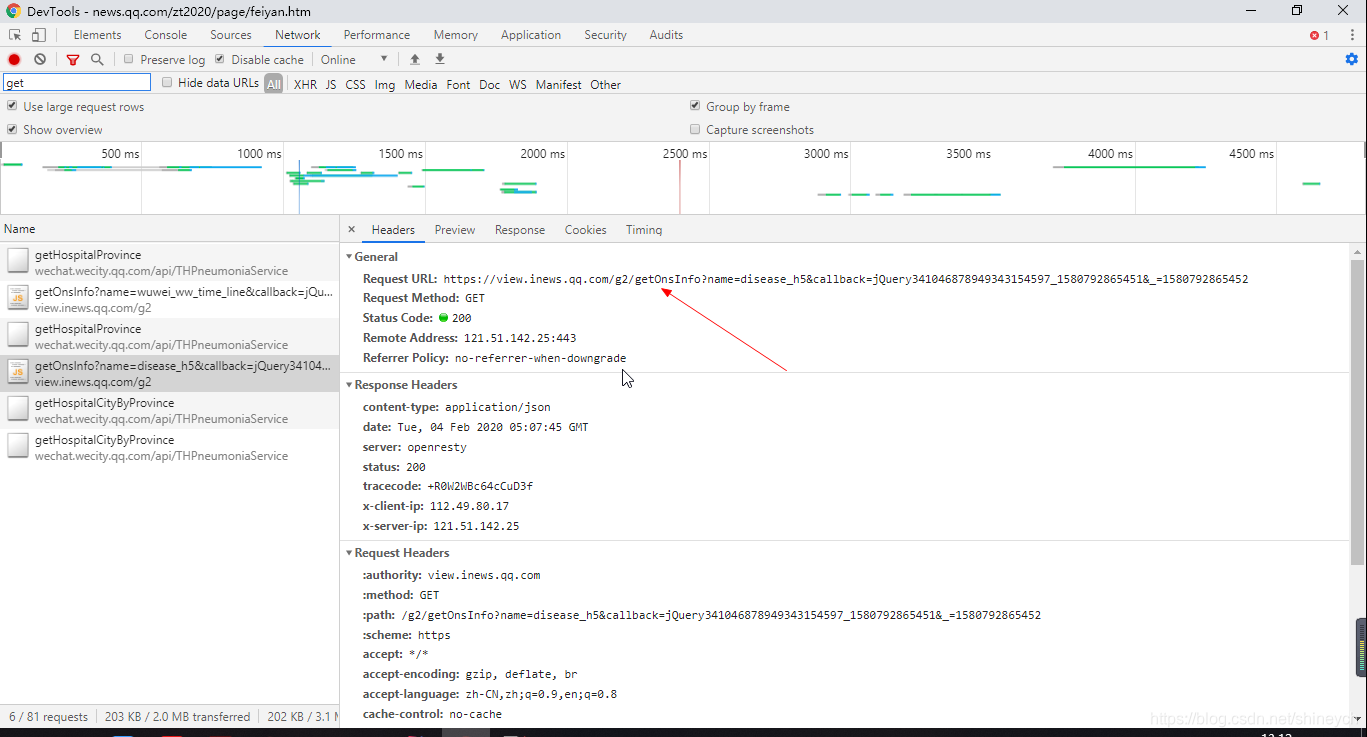
抓包分析
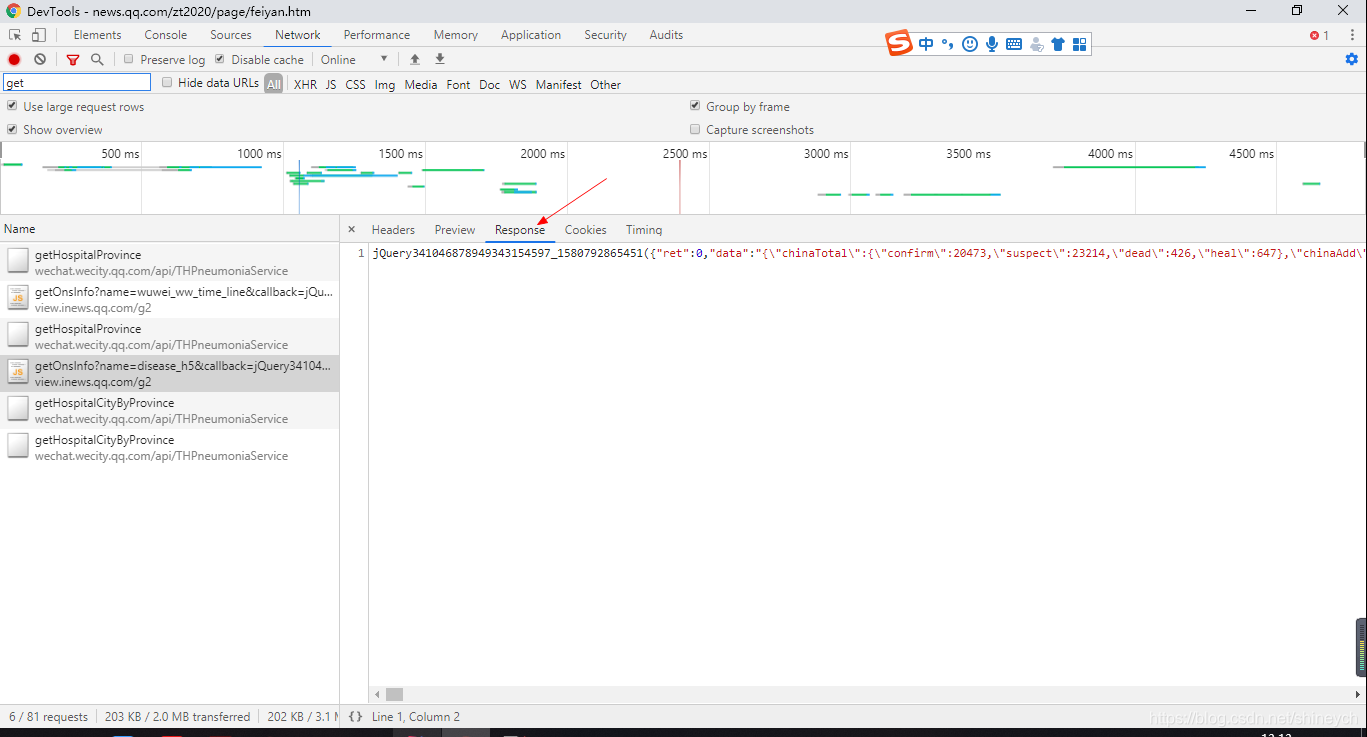
数据格式
'''
    "chinaTotal": {
		"confirm": 20473,
		"suspect": 23214,
		"dead": 426,
		"heal": 647
	},
	"chinaAdd": {
		"confirm": 3237,
		"suspect": 1656,
		"dead": 65,
		"heal": 172
	},
	"lastUpdateTime": "2020-02-04 12:43:19",
	"areaTree": [{
		"name": "中国",
		"children": [{
			"name": "湖北",
			"children": [{
				"name": "武汉",
				"total": {
					"confirm": 6384,
					"suspect": 0,
					"dead": 313,
					"heal": 303
				},
				"today": {
					"confirm": 1242,
					"suspect": 0,
					"dead": 48,
					"heal": 79
				}
			}, {
				"name": "黄冈",
				"total": {
					"confirm": 1422,
					"suspect": 0,
					"dead": 19,
					"heal": 36
				},
				"today": {
					"confirm": 176,
					"suspect": 0,
					"dead": 2,
					"heal": 9
				}
			}, {
			。。。。。。
'''
地图数据
gadm地图数据下载地址,这个数据包括国家、省、市三级行政区域,但是市级数据不准确
代码实现
#%%

import time, json, requests
from datetime import datetime
import matplotlib
import matplotlib.pyplot as plt
import matplotlib.dates as mdates
from matplotlib.font_manager import FontProperties
from mpl_toolkits.basemap import Basemap
from matplotlib.patches import Polygon
import jsonpath
import numpy as np

plt.rcParams['font.sans-serif'] = ['SimHei']  # 用来正常显示中文标签
plt.rcParams['axes.unicode_minus'] = False  # 用来正常显示负号

#%%

# 获取全国疫情报告,来源于腾讯
def catch_world_disease_report():
    timestamp = '%d'%int(time.time()*1000)
    url_area = ('https://view.inews.qq.com/g2/getOnsInfo?name=disease_h5'
           '&callback=&_=') + timestamp
    # 不处理异常了
    data_json = json.loads(requests.get(url=url_area).json()['data'])
    return data_json

world_data = catch_world_disease_report()
# print(area_data)

#%%

# 福建疫情地区分布(确诊病例)
# get请求,腾讯返回json,如下:
def catch_fj_disease_distribution():
    # world_data = catch_world_disease_report()
    dic_fj_confirm = dict()
    # 解析福建各个城市的数据
    dic_fj = jsonpath.jsonpath(world_data,
                               expr='$.areaTree[0].children[?(@.name=="福建")].children[*]')

    for item in dic_fj:
        if item['name'] not in dic_fj_confirm:
            dic_fj_confirm.update({item['name']:0})
        dic_fj_confirm[item['name']] += int(item['total']['confirm'])
    return dic_fj_confirm

area_data = catch_fj_disease_distribution()
print(area_data)

#%%

# 绘制福建省确诊分布图
def plot_fj_area_distribution():

    area_cfm_data = catch_fj_disease_distribution()

    # 标签颜色和文本
    legend_handles = [
                matplotlib.patches.Patch(color='#7FFFAA', alpha=1, linewidth=0),
                matplotlib.patches.Patch(color='#ffaa85', alpha=1, linewidth=0),
                matplotlib.patches.Patch(color='#ff7b69', alpha=1, linewidth=0),
                matplotlib.patches.Patch(color='#bf2121', alpha=1, linewidth=0),
                matplotlib.patches.Patch(color='#7f1818', alpha=1, linewidth=0),
    ]
    legend_labels = ['0人', '1-10人', '10-30人', '30-50人', '>50人']

    fig = plt.figure(facecolor='#f4f4f4', figsize=(10, 8))
    axes = fig.add_axes((0.1, 0.1, 0.8, 0.8))
    axes.set_title('福建省新型冠状病毒疫情地图', fontsize=20)
    axes.legend(legend_handles, legend_labels, bbox_to_anchor=(0.5, -0.11), loc='lower center', ncol=5)

    # 横轴墨卡托投影
    china_map = Basemap(llcrnrlon = 115.8, llcrnrlat = 23.3, urcrnrlon = 120.6, urcrnrlat = 28.4,
                        resolution = 'i', projection = 'tmerc',
                        lat_0 = 26, lon_0 = 119,
                        ax=axes)
    # gadm36_CHN_1 省一级;gadm36_CHN_2 市一级;gadm36_CHN_1 县一级
    '''
    {'GID_0': 'CHN', 'NAME_0': 'China', 'GID_1': 'CHN.4_1',
    'NAME_1': 'Fujian', 'NL_NAME_1': '福建',
    'GID_2': 'CHN.4.1_1', 'NAME_2': 'Fuzhou', 'VARNAME_2': 'Fúzhōu', 'NL_NAME_2': '福州市',
    'TYPE_2': 'Dìjíshì', 'ENGTYPE_2': 'Prefecture City', 'CC_2': '', 'HASC_2': '', 'RINGNUM': 1, 'SHAPENUM': 20}
    '''
    china_map.readshapefile('res/gadm36_CHN_shp/gadm36_CHN_2', 'states', drawbounds=True)
    china_map.drawmapboundary(fill_color='aqua')
    china_map.fillcontinents(color='white', lake_color='aqua')
    china_map.drawcoastlines()

    for info, shape in zip(china_map.states_info, china_map.states):
        prov_name = info['NAME_1'].strip()
        if prov_name != 'Fujian':
            continue

        is_reported = False  # 若龙岩没有疫情,数据源就取不到其数据,而非显示0
        city_name = info['NL_NAME_2'].strip()
        city_name = city_name.rstrip('市')
        if city_name in area_cfm_data.keys():
            is_reported = True
            # print('city: ', city_name, ' count:', fujian_data[city_name])
            if area_cfm_data[city_name] == 0:
                color = '#f0f0f0'
            elif area_cfm_data[city_name] <= 10:
                color = '#ffaa85'
            elif area_cfm_data[city_name] <= 30:
                color = '#ff7b69'
            elif  area_cfm_data[city_name] <= 50:
                color = '#bf2121'
            else:
                color = '#7f1818'

        if not is_reported:
            area_cfm_data.setdefault(city_name, 0)
            color = '#7FFFAA'

        poly = Polygon(shape, facecolor=color, edgecolor=color, linewidth=1)
        axes.add_patch(poly)

    # 绘制各市的确诊数
    # 将经纬度转换为笛卡尔坐标
    city_loc_list = [china_map(119.30 - 0.4, 26.08),
                     china_map(118.10 - 0.1, 24.46 + 0.3),
                     china_map(118.16 - 0.4, 26.65 + 0.5),
                     china_map(119.52 - 0.5, 26.65 + 0.2),  # 宁德
                     china_map(119.00 - 0.2, 25.44),
                     china_map(118.58 - 0.5, 24.93 + 0.2),  # 泉州
                     china_map(117.35, 24.52),
                     china_map(117.01 - 0.5, 25.12 + 0.2),
                     china_map(117.61 - 0.2, 26.23)]
    city_name_list = ['福州\n{0}例'.format(area_cfm_data['福州']),
                      '厦门\n{0}例'.format(area_cfm_data['厦门']),
                      '南平\n{0}例'.format(area_cfm_data['南平']),
                      '宁德\n{0}例'.format(area_cfm_data['宁德']),
                      '莆田\n{0}例'.format(area_cfm_data['莆田']),
                      '泉州\n{0}例'.format(area_cfm_data['泉州']),
                      '漳州\n{0}例'.format(area_cfm_data['漳州']),
                      '龙岩\n{0}例'.format(area_cfm_data['龙岩']),
                      '三明\n{0}例'.format(area_cfm_data['三明'])]
    for city_loc, city_name in zip(city_loc_list, city_name_list):
        # Basemap没有直接写文本的方法,故用plt的
        plt.text(city_loc[0], city_loc[1], city_name,fontsize=12,fontweight='bold',
                        ha='left',va='center',color='black')

#%%


plot_fj_area_distribution()
#%%
