介绍
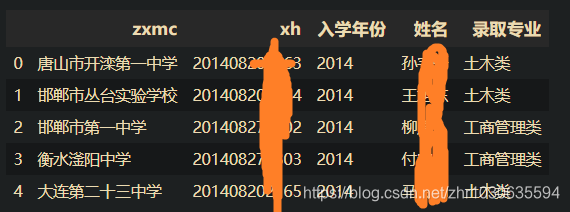
当我获得一份名单(本校4年的本科生录取姓名、学号、专业、录取中学等等)
打算利用这个名单,进行一些基础的有趣分析
基础整理
引入库,并读写表格
import numpy as np
import pandas as pd
import os
from collections import defaultdict
import matplotlib.pyplot as plt

plt.rcParams['font.sans-serif'] = ['SimHei']  # 用来正常显示中文标签
plt.rcParams['axes.unicode_minus'] = False  # 用来正常显示负号

path = "E:/code_interesting/name_of_school/"
os.chdir(path)
s1 = pd.read_excel("2014-2019 中学录取学生数据.xlsx")
s1.head()
遍历表格,将每个学生的姓氏、名字、学校分别放入表格
itertuples(): 将DataFrame迭代为元组
getattr(行, 列名):返回对应值
last_name = []  # 存放姓氏
first_name = []  # 存放名
school_name = []   # 存放学校
for row in s1.itertuples():   # 遍历dataframe中每一行
    name = getattr(row, "姓名").strip()
    school = getattr(row, "zxmc")
    if not isinstance(school, str):
        school = "无"
    else:
        school = school.strip()
    # print(school)
    school_name.append(school)
#     if "翰文" in name:
#         print(name)
    if "·" in name:    # 少数民族姓名中间为·
        name1, name2 = name.split("·")
        last_name.append(name1)
        first_name.append(name2)
    elif len(name) == 4:    # 四个字名字,前两个复姓
        last_name.append(name[:2])
        first_name.append(name[2:])
    else:
        last_name.append(name[:1])
        first_name.append(name[1:])
first_c_name = []
for s in first_name:   # 将名列表中每个名字拆分成单字
    ss = list(s)
    first_c_name += ss
print(len(first_c_name))
# print(first_c_name[0:100])
对每个列表进行个数统计(defaultdict建立默认类型的字典)
其中,对字典排序:sorted(dict.items(), key=lambda x:x[1])其中1即为按字典值排序,0为按字典项排序
last_num = defaultdict(int)   # 构建字典,每个姓氏有多少人,下同
first_num = defaultdict(int)
first_c_num = defaultdict(int)
school_num = defaultdict(int)
# print(first_name)

for i in range(len(first_name)):
    # print(i)
    # print(last_name[i])
    last_num[last_name[i]] += 1
    first_num[first_name[i]] += 1
    school_num[school_name[i]] += 1
for i in range(len(first_c_name)):
    first_c_num[first_c_name[i]] += 1
last_sort = sorted(last_num.items(), key=lambda x:x[1], reverse=True)   # 对字典进行排序
first_sort = sorted(first_num.items(), key=lambda x:x[1], reverse=True)
first_c_sort = sorted(first_c_num.items(), key=lambda x:x[1], reverse=True)
school_sort = sorted(school_num.items(), key=lambda x:x[1], reverse=True)

print(len(school_sort))

first_2c_sort = []   # 复名列表
for t in first_sort:
    if len(t[0]) == 2:
        first_2c_sort.append(t)
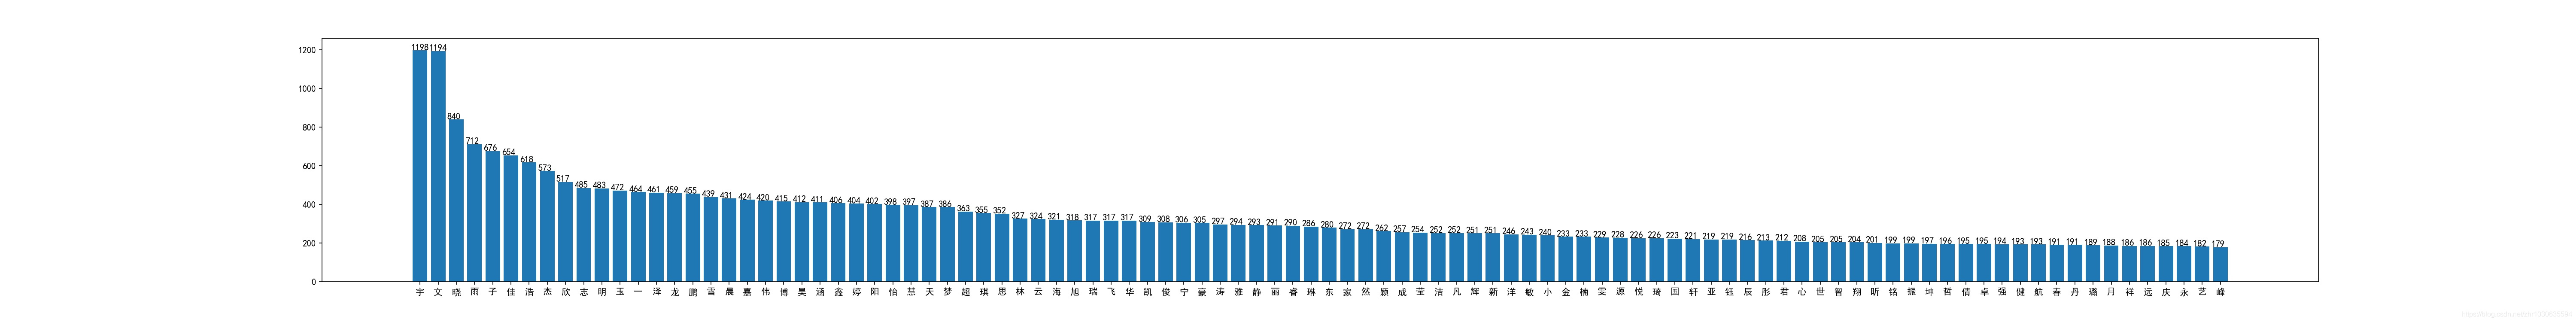
单字图表
# 单字图标
total_c = len(first_c_sort)   # 总长度
head_num = 100
x = np.array(range(head_num))
y_c = []
xlabel_c = []
for tupe in first_c_sort[0:head_num]:
    y_c.append(tupe[1])
    xlabel_c.append(tupe[0])

print(y_c)
print(x)
plt.figure(figsize=(40, 5), dpi=150)
plt.bar(x, y_c)
plt.xticks(x, xlabel_c)
for a, b in zip(x, y_c):
    plt.text(a-0.5, b+1, b)
plt.savefig("c_100.jpg")
plt.show()
plt.figure中,figsize指定了图表的尺寸(因为x太多,故为长条状),dpi指定了像素值
plt.bar绘制直方图(条状图)
plt.xticks第一个值为50个0开始的数,第二个值为50个对应的x坐标名称
plt.text为在指定位置添加文字
zip把多个可迭代元素内的项,一一对应打包成元组
复名分析
head_num = 100
print(first_2c_sort[0:20])
x = np.array(range(head_num))
y_c = []
xlabel_c = []
for tupe in first_2c_sort[0:head_num]:
    y_c.append(tupe[1])
    xlabel_c.append(tupe[0])

plt.figure(figsize=(40, 5), dpi=150)
plt.bar(x, y_c)
plt.xticks(x, xlabel_c)
plt.xticks(rotation=45)
for a, b in zip(x, y_c):
    plt.text(a-0.5, b+1, b)
plt.savefig("2c_100.jpg")
plt.show()

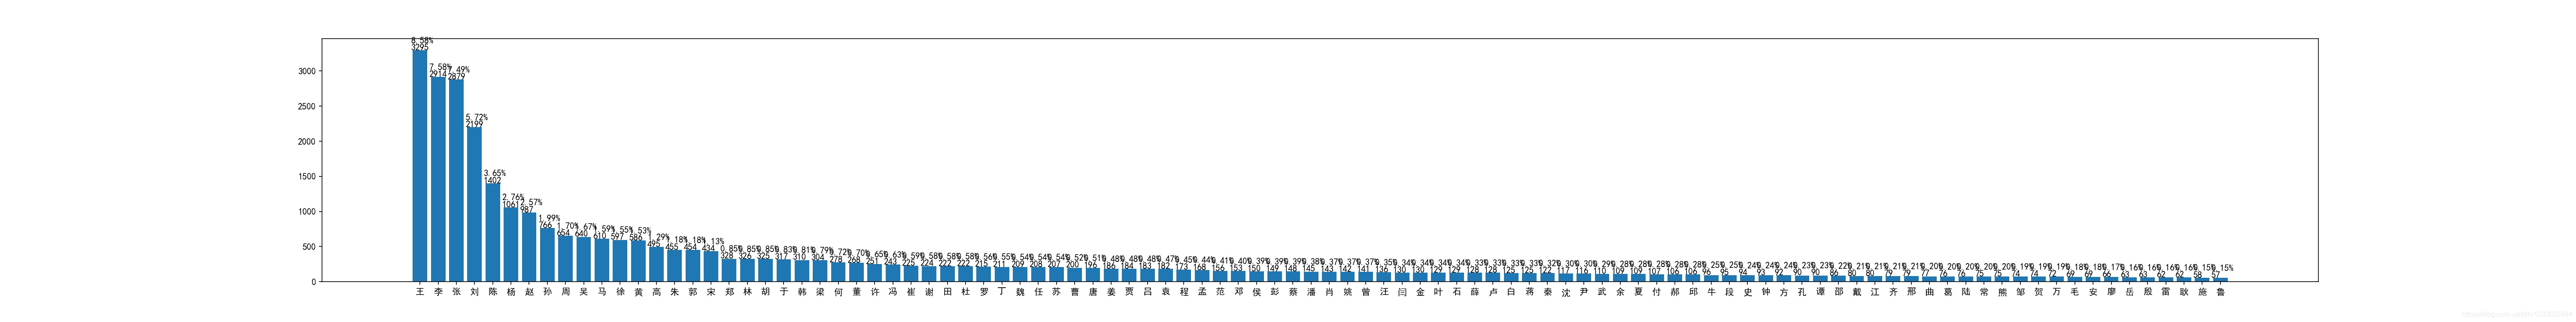
姓氏分析
total = len(last_name)
head_num = 100
print(last_sort[0:20])
x = np.array(range(head_num))
y_c = []
xlabel_c = []
for tupe in last_sort[0:head_num]:
    y_c.append(tupe[1])
    xlabel_c.append(tupe[0])

plt.figure(figsize=(40, 5), dpi=150)
plt.bar(x, y_c)
plt.xticks(x, xlabel_c)
# plt.xticks(rotation=45)
for a, b in zip(x, y_c):
    plt.text(a-0.5, b+1, b)
    plt.text(a-0.5, b+100, "{:.2f}%".format((b/total)*100))
plt.savefig("last_100.jpg")
plt.show()
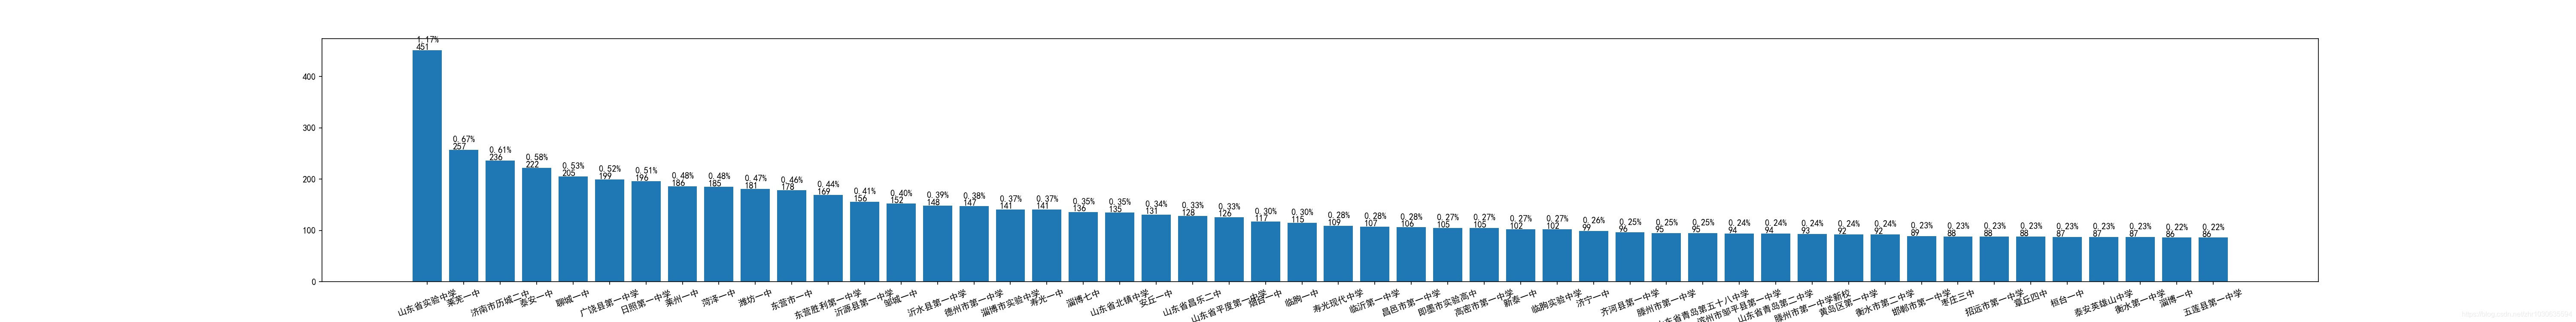
学校分析
head_num = 50
x = np.array(range(head_num))
y_c = []
xlabel_c = []
for tupe in school_sort[0:head_num]:
    y_c.append(tupe[1])
    xlabel_c.append(tupe[0])

plt.figure(figsize=(40, 5), dpi=150)
plt.bar(x, y_c)
plt.xticks(x, xlabel_c)
plt.xticks(rotation=20)
for a, b in zip(x, y_c):
    plt.text(a-0.3, b+1, b)
    plt.text(a-0.3, b+15, "{:.2f}%".format((b/total)*100))
plt.savefig("school_50.jpg")
plt.show()