构建决策树:
#!/usr/bin/env python
# -*- coding: utf-8 -*-
# @Time    : 2018/4/5 20:21
# @Author  : HJH
# @Site    :
# @File    : decision_tree_scatter.py
# @Software: PyCharm

from math import log
import operator
import treePlotter
import pickle
import os
import numpy as np
from sklearn.datasets import load_iris

def loadDataSet():
    with open('./lenses.txt') as f:
        lenses=[inst.strip().split('\t') for inst in f.readlines()]
        lensesLabels=['age','prescript','astigmatic','tearRate']
    return lenses,lensesLabels
    # digits=load_iris()
    # data=digits.data
    # temp_data=np.array(data)
    # target=digits.target
    # temp_target = np.array(target).reshape(150,1)
    # temp_dataSet=np.column_stack((temp_data,temp_target))
    # dataSet=temp_dataSet.tolist()
    # labels=digits.feature_names
    # return dataSet,labels


#计算数据集的熵
def calcShannonEnt(dataSet):
    m = len(dataSet)
    labelCounts = {}
    #为所有可能的分类创建字典
    for featVec in dataSet:
        currentLabel = featVec[-1]
        if currentLabel not in labelCounts.keys():
            labelCounts[currentLabel] = 0
        labelCounts[currentLabel] += 1
    shannonEnt = 0.0
    for key in labelCounts:
        # print(key)
        # 迭代的是字典中的键
        prob = float(labelCounts[key])/m
        shannonEnt -= prob * log(prob,2)
    return shannonEnt


#划分数据集(参数:带划分数据集,需要划分数据集中的哪一列特征,需要返回哪一个特征值)
def splitDataSet(dataSet, axis, value):#splitDataSet(dataset, 1, 1)
    #为了不修改原数据集,创建新列表
    retDataSet = []
    for featVec in dataSet:
        if featVec[axis] == value:
            reducedFeatVec = featVec[:axis]
            # print(reducedFeatVec)
            #>>[1]
            reducedFeatVec.extend(featVec[axis+1:])
            # print(reducedFeatVec)
            # >>[1, 'yes']
            retDataSet.append(reducedFeatVec)
            # print(retDataSet)
            # >>[[1, 'yes']]
    return retDataSet


#选择最好的特征集划分
def chooseBestFeatureToSplit(dataSet):
    # print(dataSet)
    #最后一列最为label
    numFeatures = len(dataSet[0]) - 1
    baseEntropy = calcShannonEnt(dataSet)
    bestInfoGain = 0.0; bestFeature = -1
    #迭代所有的特征
    for i in range(numFeatures):
        #创建唯一的分类标签列表uniqueVals
        featList = [example[i] for example in dataSet]
        # print(featList)
        uniqueVals = set(featList)
        newEntropy = 0.0
        #计算每种划分的信息熵
        for value in uniqueVals:
            subDataSet = splitDataSet(dataSet, i, value)
            prob = len(subDataSet)/float(len(dataSet))
            newEntropy += prob * calcShannonEnt(subDataSet)
        #计算信息增益
        infoGain = baseEntropy - newEntropy
        if (infoGain > bestInfoGain):
            bestInfoGain = infoGain
            bestFeature = i
        # print(infoGain,i,bestInfoGain)
    return bestFeature

#出现次数最多的类别
def majorityCnt(classList):
    classCount={}
    for vote in classList:
        if vote not in classCount.keys():
            classCount[vote] = 0
        classCount[vote] += 1
    sortedClassCount = sorted(classCount.items(), key=operator.itemgetter(1), reverse=True)
    return sortedClassCount[0][0]

#创建决策树
def createTree(dataSet,labels):
    classList = [example[-1] for example in dataSet]
    #如果类别完全相同则停止继续划分
    if classList.count(classList[0]) == len(classList):
        return classList[0]
    #使用完所有的特征仍不能将数据集划分为仅包含唯一类别的分组
    if len(dataSet[0]) == 1:
        return majorityCnt(classList)

    bestFeat = chooseBestFeatureToSplit(dataSet)
    bestFeatLabel = labels[bestFeat]
    myTree = {bestFeatLabel:{}}
    #删除标签
    del(labels[bestFeat])
    featValues = [example[bestFeat] for example in dataSet]
    uniqueVals = set(featValues)
    for value in uniqueVals:
        subLabels = labels[:]
        # print(subLabels)
        myTree[bestFeatLabel][value] = createTree(splitDataSet(dataSet, bestFeat, value),subLabels)
    return myTree

#决策树的分类函数
def classify(inputTree, featLabels, testVec):
    #第一个分类特征的键
    firstStr = list(inputTree.keys())[0]
    # 第一个分类特征的值,即第二个字典
    secondDict = inputTree[firstStr]
    # print(secondDict)
    #将标签转换为索引,index方法查找当前列表中第一个匹配firstStr的索引
    featIndex = featLabels.index(firstStr)
    # print(featIndex)
    #根据索引获取测试集中对应特征的值
    key = testVec[featIndex]
    valueOfFeat = secondDict[key]
    if isinstance(valueOfFeat, dict):
        classLabel = classify(valueOfFeat, featLabels, testVec)
    else:
        classLabel = valueOfFeat
    return classLabel

#用pickle序列化存储决策树
def storeTree(inputTree, filename):
    fw = open(filename, 'wb')
    pickle.dump(inputTree, fw)
    fw.close()


def grabTree(filename):
    with open(filename,'rb') as fr:
        myTree=pickle.load(fr)
    return myTree


if __name__=='__main__':
    if os.path.exists('./strotree.txt'):
        myTree=grabTree('./strotree.txt')
    else:
        dataset, labels = loadDataSet()
        myTree = createTree(dataset, labels)
        storeTree(myTree,'./strotree.txt')
    dataset, labels = loadDataSet()
    print(classify(myTree,labels,["young","myope","no","normal"]))
    treePlotter.createPlot(myTree)
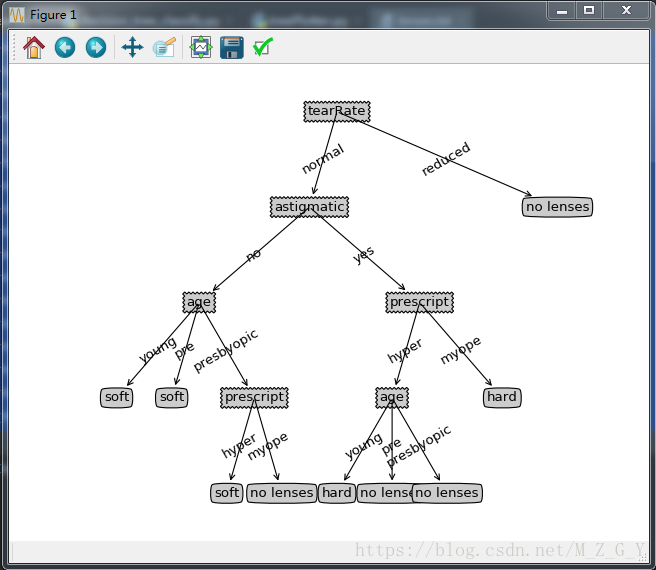
可视化决策树:
#!/usr/bin/env python
# -*- coding: utf-8 -*-
# @Time    : 2018/4/6 20:28
# @Author  : HJH
# @Site    :
# @File    : treePlotter.py
# @Software: PyCharm

import matplotlib.pyplot as plt

# 定义文本框和箭头格式
decisionNode = dict(boxstyle="sawtooth", fc="0.8")
leafNode = dict(boxstyle="round4", fc="0.8")
arrow_args = dict(arrowstyle="<-")


# 获取叶子节点数目
def getNumLeafs(myTree):
    numLeafs = 0
    firstStr = list(myTree.keys())[0]
    secondDict = myTree[firstStr]
    for key in secondDict.keys():
        #如果不是字典类型,就是叶子结点
        if type(secondDict[key]).__name__ == 'dict':
            numLeafs += getNumLeafs(secondDict[key])
        else:
            numLeafs += 1
    return numLeafs


# 获取树的层数
def getTreeDepth(myTree):
    maxDepth = 0
    firstStr = list(myTree.keys())[0]
    secondDict = myTree[firstStr]
    for key in secondDict.keys():
        # 如果不是字典类型,就是叶子结点
        if type(secondDict[key]).__name__ == 'dict':
            thisDepth = 1 + getTreeDepth(secondDict[key])
        else:
            thisDepth = 1
        if thisDepth > maxDepth: maxDepth = thisDepth
    return maxDepth


# 绘制带箭头的注解
def plotNode(nodeTxt, centerPt, parentPt, nodeType):
    createPlot.ax1.annotate(nodeTxt, xy=parentPt, xycoords='axes fraction',
                            xytext=centerPt, textcoords='axes fraction',
                            va="center", ha="center", bbox=nodeType, arrowprops=arrow_args)


#在父子节点中填充文本信息
def plotMidText(cntrPt, parentPt, txtString):
    xMid = (parentPt[0] - cntrPt[0]) / 2.0 + cntrPt[0]
    yMid = (parentPt[1] - cntrPt[1]) / 2.0 + cntrPt[1]
    createPlot.ax1.text(xMid, yMid, txtString, va="center", ha="center", rotation=30)

#画树的主要方法
def plotTree(myTree, parentPt, nodeTxt):
    #树的宽度和高度,用来判断树的位置
    numLeafs = getNumLeafs(myTree)
    depth = getTreeDepth(myTree)
    firstStr =list(myTree.keys())[0]
    cntrPt = (plotTree.xOff + (1.0 + float(numLeafs)) / 2.0 / plotTree.totalW, plotTree.yOff)
    #标记子节点属性值
    plotMidText(cntrPt, parentPt, nodeTxt)
    plotNode(firstStr, cntrPt, parentPt, decisionNode)
    secondDict = myTree[firstStr]
    #减小y偏移
    plotTree.yOff = plotTree.yOff - 1.0 / plotTree.totalD
    for key in secondDict.keys():
        # 如果不是字典类型,就是叶子结点
        if type(secondDict[key]).__name__ == 'dict':
            plotTree(secondDict[key], cntrPt, str(key))  # recursion
        else:
            plotTree.xOff = plotTree.xOff + 1.0 / plotTree.totalW
            plotNode(secondDict[key], (plotTree.xOff, plotTree.yOff), cntrPt, leafNode)
            plotMidText((plotTree.xOff, plotTree.yOff), cntrPt, str(key))
    plotTree.yOff = plotTree.yOff + 1.0 / plotTree.totalD


# if you do get a dictonary you know it's a tree, and the first element will be another dict

def createPlot(inTree):
    fig = plt.figure(1, facecolor='white')
    fig.clf()
    axprops = dict(xticks=[], yticks=[])
    createPlot.ax1 = plt.subplot(111, frameon=False, **axprops)  # no ticks
    # createPlot.ax1 = plt.subplot(111, frameon=False) #ticks for demo puropses
    #全局变量
    plotTree.totalW = float(getNumLeafs(inTree))
    plotTree.totalD = float(getTreeDepth(inTree))
    plotTree.xOff = -0.5 / plotTree.totalW;
    plotTree.yOff = 1.0;
    plotTree(inTree, (0.5, 1.0), '')
    plt.show()


# def createPlot():
#     fig = plt.figure(1, facecolor='white')
#     fig.clf()
#     createPlot.ax1 = plt.subplot(111, frameon=False)  # ticks for demo puropses
#     plotNode('a decision node', (0.5, 0.1), (0.1, 0.5), decisionNode)
#     plotNode('a leaf node', (0.8, 0.1), (0.3, 0.8), leafNode)
#     plt.show()


def retrieveTree(i):
    listOfTrees = [{'no surfacing': {0: 'no', 1: {'flippers': {0: 'no', 1: 'yes'}}}},
                   {'no surfacing': {0: 'no', 1: {'flippers': {0: {'head': {0: 'no', 1: 'yes'}}, 1: 'no'}}}}
                   ]
    return listOfTrees[i]
lenses.txt:
young   myope  no reduced    no lenses
young  myope  no normal soft
young  myope  yes    reduced    no lenses
young  myope  yes    normal hard
young  hyper  no reduced    no lenses
young  hyper  no normal soft
young  hyper  yes    reduced    no lenses
young  hyper  yes    normal hard
pre    myope  no reduced    no lenses
pre    myope  no normal soft
pre    myope  yes    reduced    no lenses
pre    myope  yes    normal hard
pre    hyper  no reduced    no lenses
pre    hyper  no normal soft
pre    hyper  yes    reduced    no lenses
pre    hyper  yes    normal no lenses
presbyopic myope  no reduced    no lenses
presbyopic myope  no normal no lenses
presbyopic myope  yes    reduced    no lenses
presbyopic myope  yes    normal hard
presbyopic hyper  no reduced    no lenses
presbyopic hyper  no normal soft
presbyopic hyper  yes    reduced    no lenses
presbyopic hyper  yes    normal no lenses