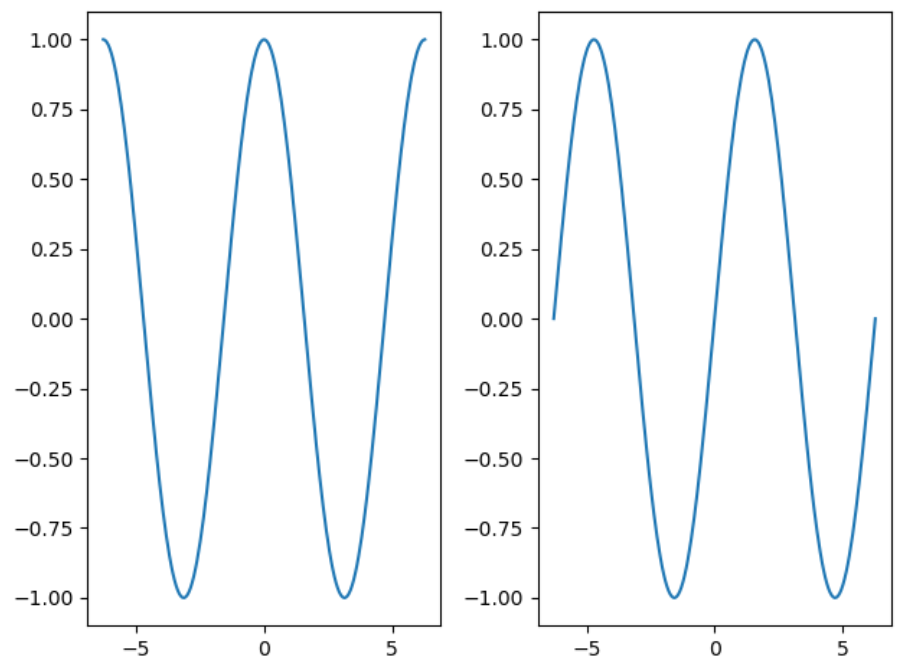
(1)函数subplot()绘制网格区域中的几何形状相同的子区布局
import matplotlib.pyplot as plt
import numpy as np
'''函数subplot的介绍:函数
subplot(numEows, numCols, plotNum)
或者subplot(CRN),CRN的含义是将画布
分成C行R列,该子区被放在第N个位置上
'''

x = np.linspace(-2*np.pi, 2*np.pi, 200)
y = np.sin(x)
y1 = np.cos(x)

plt.subplot(122)
plt.plot(x, y)

plt.subplot(121)
plt.plot(x, y1)

plt.show()
(二)极坐标下绘制折线图和散点图
import matplotlib.pyplot as plt
import numpy as np
import matplotlib as mpl
'''函数subplot的介绍:函数
subplot(numEows, numCols, plotNum)
或者subplot(CRN),CRN的含义是将画布
分成C行R列,该子区被放在第N个位置上
'''

x = np.linspace(0, 1, 100)
y = 2*np.pi*x

x1 = 30*np.random.rand(100)
y1 = 2*np.pi*np.random.rand(100)
colors = np.random.rand(100)
size = 50*x1

ax = plt.subplot(121, polar=True)
ax.plot(x, y, color="r", linestyle="-", linewidth=2)

ax1 = plt.subplot(122, polar=True)
ax1.scatter(x1, y1, s=size, c=colors, cmap=mpl.cm.PuOr, marker="*")


plt.show()

(三)非等分画布的实现
fig=plt.figure()
fig.add_subplot(121)
fig.add_subplot(222)
fig.add_subplot(224)
(四)高级非等分画布实现
import matplotlib.pyplot as plt
import numpy as np
import matplotlib as mpl
'''函数subplot2grid()的介绍:函数
subplot2grid((a, b), (c, d), rowspan=m, colspan=n)
的含义是将画布分成a行b列,以c行d列为起点,跨越m行n列
'''
mpl.rcParams["font.sans-serif"]=["SimHei"]
mpl.rcParams["axes.unicode_minus"]=False

plt.subplot2grid((2, 3), (0, 0), colspan=2)
x = np.linspace(0, 4, 100)
y = np.random.randn(100)
plt.scatter(x, y, c="c")
plt.title("散点图")

plt.subplot2grid((2, 3), (0, 2))
plt.title("空白绘图区域")

plt.subplot2grid((2, 3),(1, 0), colspan=3)
y1 = np.sin(x)

plt.plot(x, y1, lw=2, ls="-")
plt.xlim(0, 3)
plt.grid(True, ls="-", c="r")
plt.title("折线图")
#title是绘制坐标轴Axes实例的图形标题的文本内容
plt.suptitle("subplot2grid()函数展示", fontsize=25)
#suptitle是绘制Figure画布标题的文本内容
plt.show()

(5)函数subplots()函数subplots的返回值是一个画布对象figure和坐标轴实例ax
fig, ax=subplots(2, 2)的含义,生成一个画布对象和一个坐标轴实例数组,分别储存在fig和ax中
可以通过访问ax[0],ax[1]来访问坐标轴实例