'''
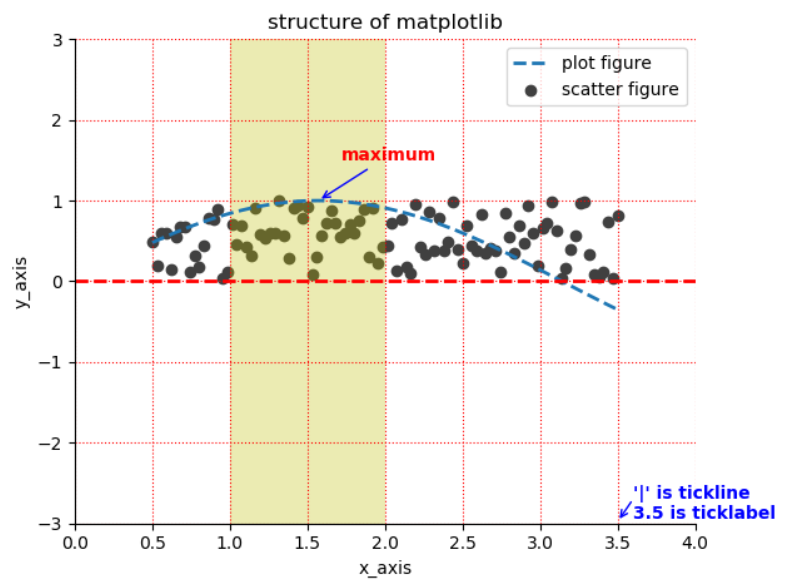
将前面的知识进行练习
plot,scatter,legend等
'''
import matplotlib.pyplot as plt
import numpy as np
from matplotlib import cm as cm
#定义数据
x = np.linspace(0.5, 3.5, 100)
y = np.sin(x)
y1 = np.random.rand(100)
#scatter图
plt.scatter(x, y1, c = "0.25", label = "scatter figure")
#plot图
plt.plot(x, y, ls = "--", lw = 2, label = "plot figure")
#以下蓝色代码未学,后面会讲
#some clean up(removing chartunk)
#turn the top spine and the right spine off
for spine in plt.gca().spines.keys():
if spine == "top" or spine == "right":
plt.gca().spines[spine].set_color("none")
#turn bottom tick for x-axis on
plt.gca().xaxis.set_ticks_position("bottom")
#set tick_line position of bottom
#turn left tick for y-axis on
plt.gca().yaxis.set_ticks_position("left")
#set tick_line position of left
#设置x,y的显示区间
plt.xlim(0, 4)
plt.ylim(-3, 3)
#设置轴标签
plt.xlabel("x_axis")
plt.ylabel("y_axis")
#设置x,y轴网格线
plt.grid(True,ls = ":", color = "r")
#添加垂直参考线
plt.axhline(y = 0.0, c="r", ls="--",lw=2)
#添加参考区域
plt.axvspan(xmin=1.0, xmax=2.0, facecolor="y",alpha=0.3)
#添加指向型注释文本
plt.annotate("maximum", xy=(np.pi/2, 1.0),xytext=((np.pi/2)+.15,1.5),weight="bold",color="r",arrowprops=dict(arrowstyle="->", connectionstyle="arc3",color="b"))
plt.annotate("", xy=(3.5, -2.98),xytext=((3.6,-2.70)), arrowprops=dict(arrowstyle="->", connectionstyle="arc3",color="b"))
#设置文本
plt.text(3.6,-2.7,"'|' is tickline", weight="bold",color="b")
plt.text(3.6,-2.95,"3.5 is ticklabel", weight="bold",color="b")
#设置标题
plt.title("structure of matplotlib")
#设置图例
plt.legend()
#显示图形
plt.show()