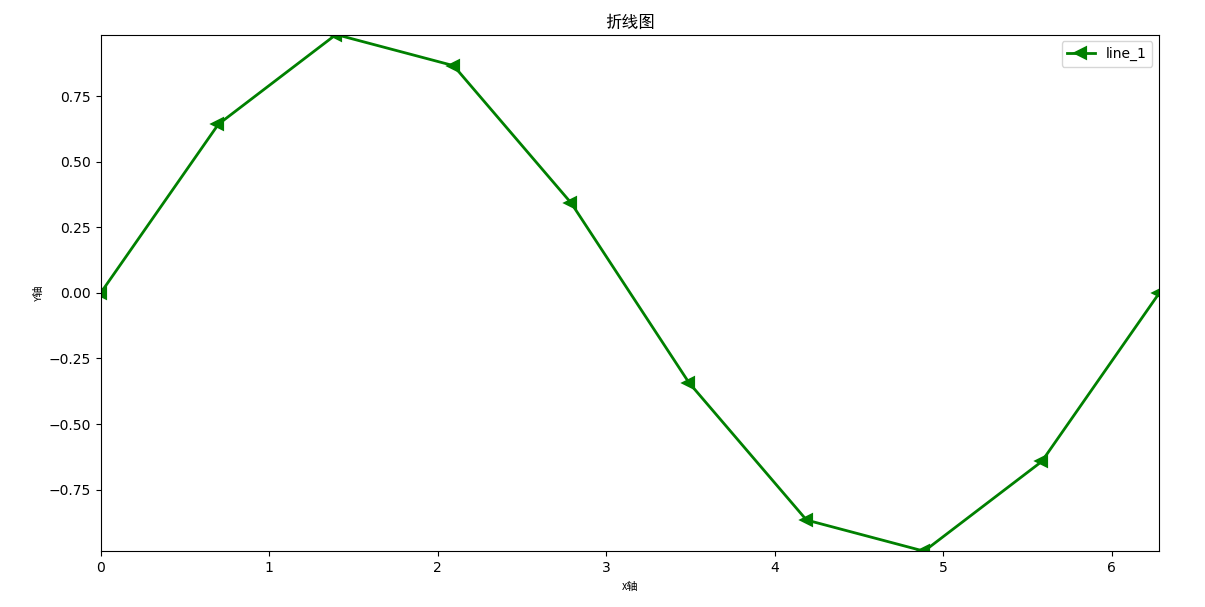
  import numpy as np
  import matplotlib.pyplot as plt
  import matplotlib

  #数据准备
    #numpy.linspace(start, stop, num=50, endpoint=True, retstep=False, dtype=None)
    x=np.linspace(0, 2* np.pi, 10)
    y=np.sin(x)

    #画线
    #lw=线宽
    #label=本条线的图例名称
    #marker
    #markeredgewidth 或 mew
    line1=plt.plot(x,y,'g',label='line_1',lw=2,marker='<',mew=3)

    plt.axis([min(x), max(x), min(y), max(y)])#坐标轴范围
    plt.legend()#显示图例
    plt.xlabel("X轴",fontproperties='SimHei',fontsize=8)#坐标轴标注
    plt.ylabel("Y轴",fontproperties='SimHei',fontsize=8)
    plt.title('折线图',fontproperties='SimHei',fontsize=12)#标题
    plt.show()