版权声明:本文为博主原创文章,未经博主允许不得转载。 https://blog.csdn.net/TH_NUM/article/details/82774467
import matplotlib.pyplot as plt
x1 = [1, 2, 3, 4, 5, 6, 7, 8, 9, 10, 11, 12, 13]
y1 = [30, 31, 31, 32, 33, 35, 35, 40, 47, 62, 99, 186, 480]
x2 = [1, 2, 3, 4, 5, 6, 7, 8, 9, 10, 11, 12, 13, 14]
y2 = [32, 32, 32, 33, 34, 34, 34, 34, 38, 43, 54, 69, 116, 271]
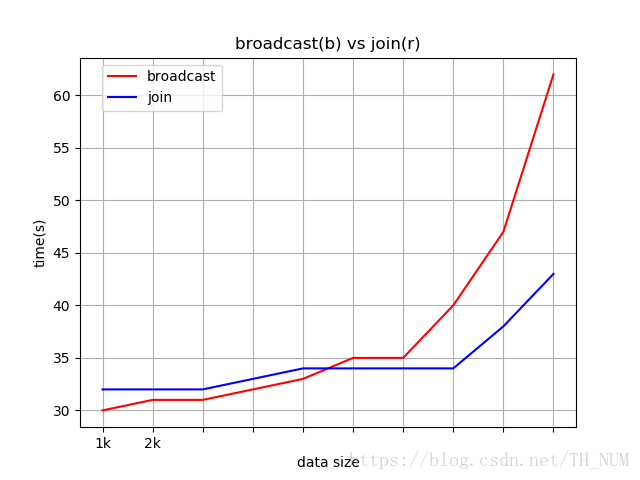
x3 = [1, 2, 3, 4, 5, 6, 7, 8, 9, 10]
y3 = [30, 31, 31, 32, 33, 35, 35, 40, 47, 62]
x4 = [1, 2, 3, 4, 5, 6, 7, 8, 9, 10]
y4 = [32, 32, 32, 33, 34, 34, 34, 34, 38, 43]
group_labels = ['64k', '128k', '256k', '512k', '1024k', '2048k', '4096k', '8M', '16M', '32M', '64M', '128M', '256M',
'512M']
plt.title('broadcast(b) vs join(r)')
plt.xlabel('data size')
plt.ylabel('time(s)')
# plt.plot(x1, y1,'r', label='broadcast')
# plt.plot(x2, y2,'b',label='join')
# plt.xticks(x1, group_labels, rotation=0)
plt.plot(x3, y3, 'r', label='broadcast')
plt.plot(x4, y4, 'b', label='join')
plt.xticks(x3, ['1k',' ','2k'], rotation=0)
plt.legend(bbox_to_anchor=[0.3, 1])
plt.grid()
plt.show()
输出: