作者:明天依旧可好 | 柯尊柏
工具:Jupyter notebook
环境:Python 3.6.5
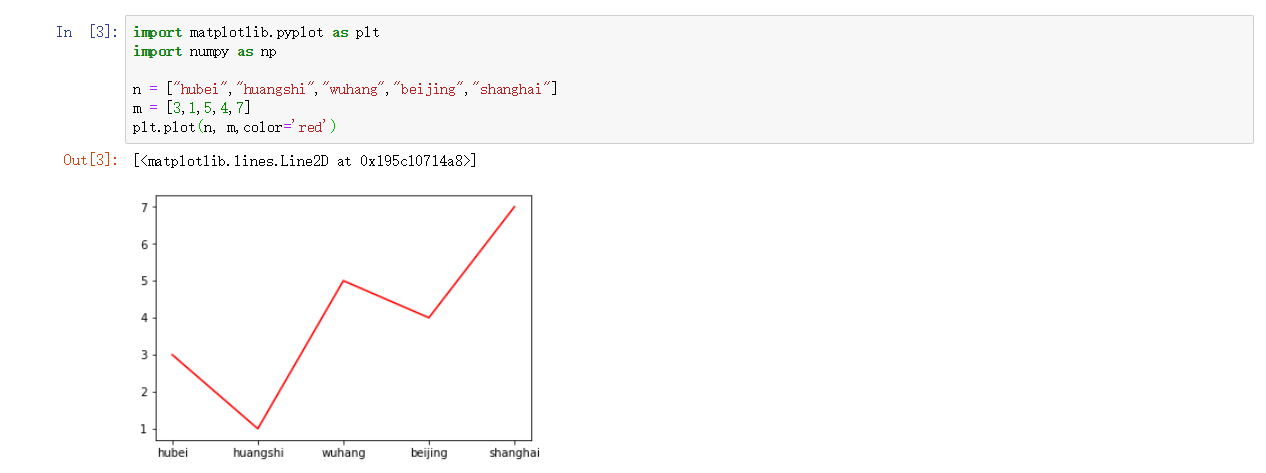
与上一份代码相比我们仅仅是去掉了plt.plot()中参数x。
import matplotlib.pyplot as plt
import numpy as np

n = ["hubei","huangshi","wuhang","beijing","shanghai"]
m = [3,1,5,4,7]
plt.plot(n, m,color='red')
作者:明天依旧可好 | 柯尊柏
工具:Jupyter notebook
环境:Python 3.6.5
与上一份代码相比我们仅仅是去掉了plt.plot()中参数x。
import matplotlib.pyplot as plt
import numpy as np
n = ["hubei","huangshi","wuhang","beijing","shanghai"]
m = [3,1,5,4,7]
plt.plot(n, m,color='red')