一.Series 对象(一维数组)
Series是一种类似与一维数组的对象,由下面两个部分组成:

  values:一组数据(ndarray类型)
  index:相关的数据索引标签
1.创建
# 导入模块

from pandas import Series,DataFrame
import pandas as pd
import numpy as np
①使用列表创建
#使用列表创建Series

#默认索引
Series(data=[1,2,3])

#指定索引
Series(data=[1,2,3],index=['a','b','c'])
结果为:

a    1
b    2
c    3
dtype: int64
②使用numpy 创建
s = Series(data=np.random.randint(0,100,size=(3,)),index=['a','b','c'])
结果为:

a    37
b    13
c    71
dtype: int32
③使用字典创建
由字典创建:不能在使用index.但是依然存在默认索引

注意:数据源必须为一维数据
dic = {
    '语文':99,
    '数学':100,
    '英语':88,
    '理综':120
}
s = Series(data=dic)
结果为:

数学    100
理综    120
英语     88
语文     99
dtype: int64
2.索引和切片
①索引
s[0]


结果为:
数学 100
②切片
s[0:2]
结果为:

数学    100
理综    120
dtype: int64
3.基本概念
①添加数据
s['毛概'] = 111
结果为:

数学    100
理综    120
英语     88
语文     99
毛概    111
dtype: int64
②查看属性
shape 形状,
size 总长度,
index 索引,
values 值
示例:

s.values
array([100, 120, 88, 99, 111], dtype=int64)
③查值
可以使用s.head(),tail()分别查看前n个和后n个值
示例:
s.tail(2)
语文     99
毛概    111
dtype: int64
④去重
s1 = Series(data=[1,1,1,2,2,2,3,3,4,56,6,7,8,8,8,7])
s1.unique()
结果为:

array([ 1,  2,  3,  4, 56,  6,  7,  8], dtype=int64)
4.Series的运算
在运算中自动对齐不同索引的数据
如果索引不对应,则补NaN
①运算
示例:
s1 = Series(data=[1,2,3],index=['a','b','c'])
s2 = Series(data=[1,2,3],index=['a','b','d'])
s = s1 + s2
结果为:

a    2.0
b    4.0
c    NaN
d    NaN
dtype: float64
②可以使用pd.isnull(),pd.notnull(),
或s.isnull(),notnull()函数检测缺失数据
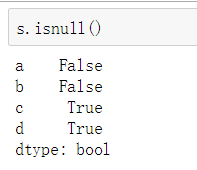
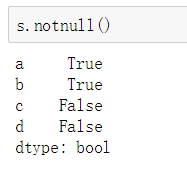
③ boolean值可以作为Series的索引,只保留True对应的元素值,忽略False对应的元素值

二. DataFrame
DataFrame是一个【表格型】的数据结构。DataFrame由按一定顺序排列的多列数据组成。
设计初衷是将Series的使用场景从一维拓展到多维。DataFrame既有行索引,也有列索引。
行索引:index
列索引:columns
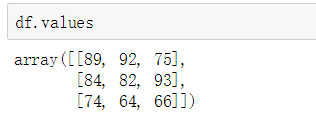
值:values
1.创建
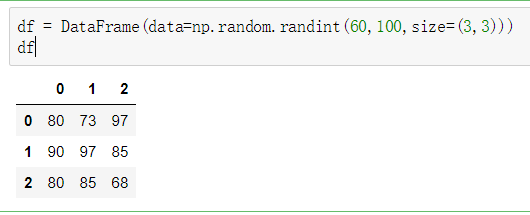
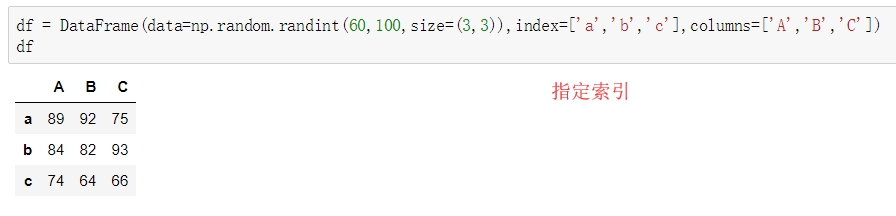
①使用ndarray创建DataFrame
②使用字典创建
2.属性
values、值
columns、 列索引
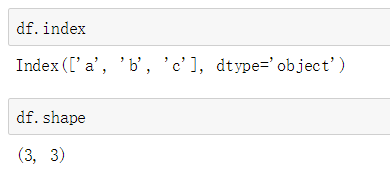
index、行索引
shape 形状
3.索引和切片
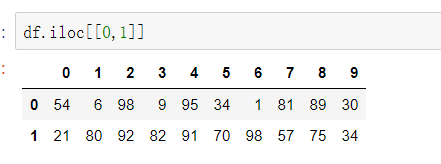
df[0] #列索引 df.iloc[0] #行索引 df.iloc[1,2] #定位一个元素
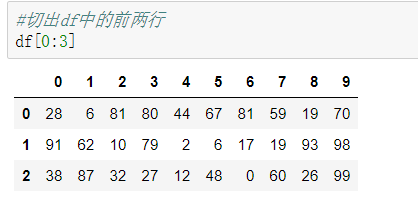
df[0:2] #切行 df.iloc[:,0:2] #切列
对行进行索引
- 使用.loc[]加index来进行行索引(设置了index)
- 使用.iloc[]加整数来进行行索引
①修改索引

②获取前两列

③获取前两行
④定位元素

⑤切出前两行
⑥切出前两列

4.运算
同Series一样:

  在运算中自动对齐不同索引的数据
  如果索引不对应,则补NaN
示例:

5.练习
============================================
练习1:
假设ddd是期中考试成绩,ddd2是期末考试成绩,请自由创建ddd2,并将其与ddd相加,求期中期末平均值。
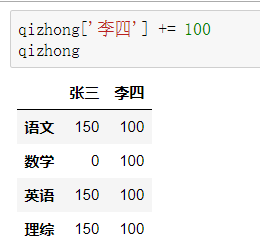
假设张三期中考试数学被发现作弊,要记为0分,如何实现?
李四因为举报张三作弊立功,期中考试所有科目加100分,如何实现?
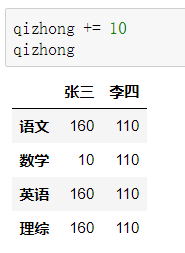
后来老师发现有一道题出错了,为了安抚学生情绪,给每位学生每个科目都加10分,如何实现?
============================================
①
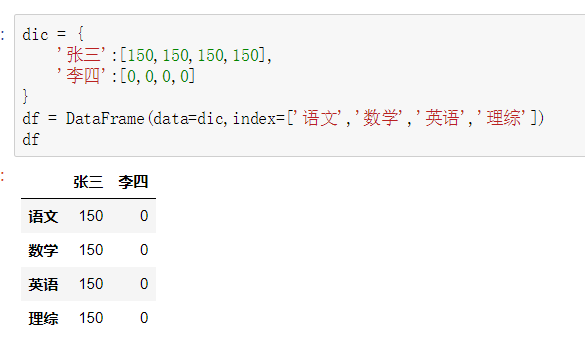
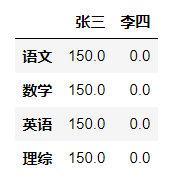
# 创建(期中和期末一样的值)

dic = {
    '张三':[150,150,150,150],
    '李四':[0,0,0,0]
}
df = DataFrame(data=dic,index=['语文','数学','英语','理综'])
qizhong = df
qimo = df
#求平均:

(qizhong+qimo)/2
②

③
④
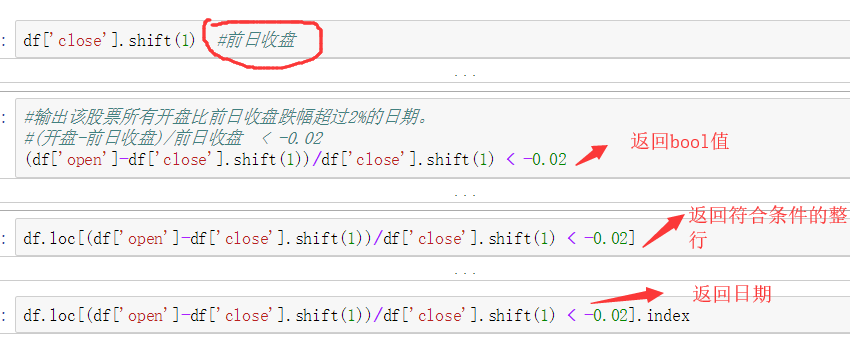
练习2:
使用tushare包获取某股票的历史行情数据。
输出该股票所有收盘比开盘上涨3%以上的日期。
输出该股票所有开盘比前日收盘跌幅超过2%的日期。
假如我从2010年1月1日开始,每月第一个交易日买入1手股票,每年最后一个交易日卖出所有股票,到今天为止,我的收益如何?
安装 tushare 模块

  pip install tushare
①
import tushare as ts
df = ts.get_k_data(code='600519',start='2000-01-01')
# 将时间作为索引
#将请求的数据存储起来
df.to_csv('./600519.csv')
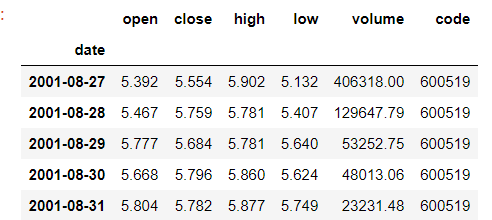
#将600519.csv文件中的数据读取到df, 索引,时间类型
df = pd.read_csv('./600519.csv',index_col='date',parse_dates=['date'])
# 删除无用的列,1表示列,并同步映射原数据
df.drop(labels='Unnamed: 0',axis=1,inplace=True)
#展示前五行数据
df.head(5)
②

③
④
#重新划定交易范围

df = df['2010-01':'2019-06']
df #2010-2019年所有的交易数据
#将df中所有月的第一个交易日对应的行数据取出(数据的重新取样)
df_monthly = df.resample('M').first()
# 每年的最后一个交易日
df_yearly = df.resample('A').last()
df_yearly = df_yearly[:-1]
price_last = df['open'][-1]

#Pandas提供了resample函数用便捷的方式对时间序列进行重采样,根据时间粒度的变大或者变小分为降采样和升采样:
df_monthly = df.resample("M").first()
df_yearly = df.resample("A").last()[:-1] #去除最后一年
cost_money = 0
hold = 0 #每年持有的股票
for year in range(2010, 2020):
    #买股票要花的钱 str(year)可获取某一年的所有数据
    cost_money -= df_monthly.loc[str(year)]['open'].sum()*100
    hold += len(df_monthly[str(year)]['open']) * 100

    if year != 2019:
      卖股票收入的钱
        cost_money += df_yearly[str(year)]['open'][0] * hold
        hold = 0 #每年持有的股票
 #2019 年买股票的钱
cost_money += hold * price_last

print(cost_money)