版权声明:本文为博主原创文章,未经博主允许不得转载。 https://blog.csdn.net/qq_20042935/article/details/89878568
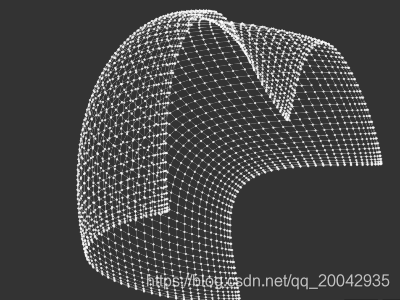
效果图
源代码
function createNodes(widthCount, heightCount) {
    var nodes = [];
    for (var i = 0; i < widthCount; i++) {
        for (var j = 0; j < heightCount; j++) {
            nodes.push({
                x: Math.random() * window.innerWidth,
                y: Math.random() * window.innerHeight,
                value: 1
            });
        }
    }
    return nodes;
}

function createEdges(widthCount, heightCount) {
    var edges = [];
    for (var i = 0; i < widthCount; i++) {
        for (var j = 0; j < heightCount; j++) {
            if (i < widthCount - 1) {
                edges.push({
                    source: i + j * widthCount,
                    target: i + 1 + j * widthCount,
                    value: 1
                });
            }
            if (j < heightCount - 1) {
                edges.push({
                    source: i + j * widthCount,
                    target: i + (j + 1) * widthCount,
                    value: 1
                });
            }
        }
    }
    return edges;
}

var nodes = createNodes(50, 50);
var edges = createEdges(50, 50);

option = {
    series: [{
        type: 'graphGL',
        nodes: nodes,
        edges: edges,
        itemStyle: {
            color: 'rgba(255,255,255,0.8)'
        },
        lineStyle: {
            color: 'rgba(255,255,255,0.8)',
            width: 3
        },
        forceAtlas2: {
            steps: 5,
            jitterTolerence: 10,
            edgeWeightInfluence: 4
        }
    }]
};