记录一下大屏开发中使用到的echarts-gl
大屏的页面根据需求前前后后改了几个版本了,地图的样式也改了又改
这里记录一下,因为echarts属性用到的比较多也比较杂,防止以后需要用到忘记了
目录
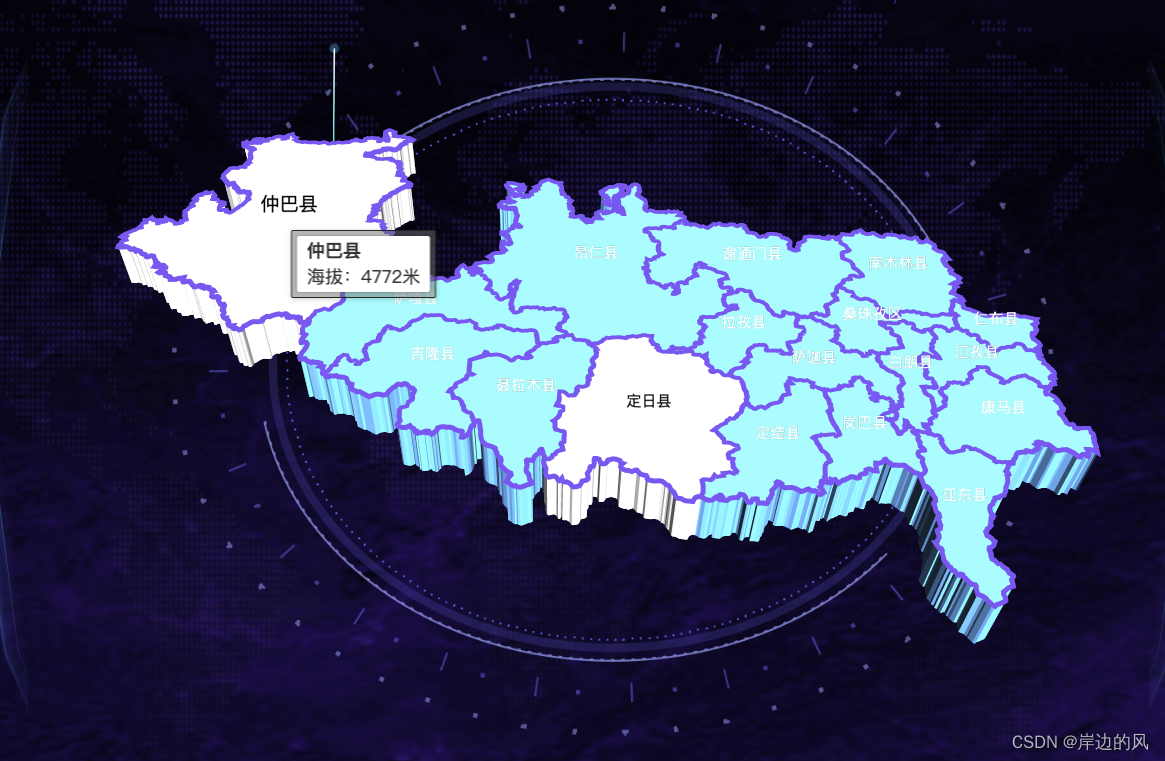
适应大屏风格的发光地图效果,用了两个图层实现叠加背景图片实现:编辑
初始效果
效果图:
适应大屏风格的发光地图效果,用了两个图层实现叠加背景图片实现: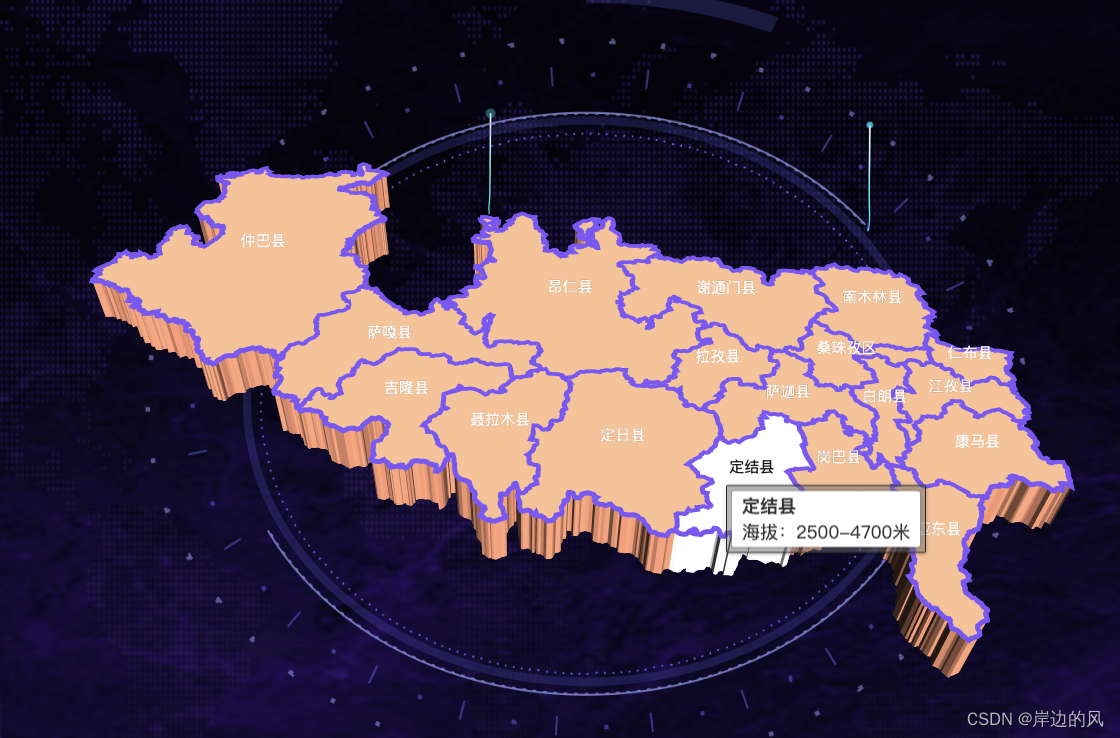
安装命令
首先在项目中安装echarts与echarts gl(echers gl用于3d)
安装命令
npm install echarts --save //echarts安装命令
npm install echarts-gl //echarts-gl安装命令
安装完成后在package.json中查看有没有安装成功
安装成功后在main.js中引入
import echartsGL from 'echarts-gl' // 引入echarts
Vue.prototype.$echartsGL = echartsGL // 引入组件(将echarts注册为全局)
使用 http://datav.aliyun.com/portal/school/atlas/area_selector这个工具获取要显示的地图数据
存放在放静态资源的地方,创建一个json文件
这些没问题后,就可以在组件中进行操作了
<template>
  <div id="hello">
  </div>
</template>
创建一个div用来挂载地图
在script中引入存放地图数据的json文件
import * as echarts from 'echarts';
import geoJson from "../assets/mapJSon/rkz.json"
import coordtransform from 'coordtransform'
export default {
  name: 'MapDemo',
  data() {
    return {
      dataIndex: 0,
      mTime:null
    }
  },
  props: {
    msg: String
  },
  methods: {
    convertCoord(coord) {
      const gcj02 = coordtransform.wgs84togcj02(coord[0], coord[1])
      const bd09 = coordtransform.gcj02tobd09(gcj02[0], gcj02[1])
      return bd09
    },


  },
  mounted() {
    // 基于准备好的dom,初始化echarts实例


    var myChart = echarts.init(document.getElementById('hello'));

    var scatterData = [
      { name: "亚东县", value: "2945米" },
      { name: "仁布县", value: "3950米" },
      { name: "谢通门县", value: "4008米" },
      { name: "萨迦县", value: "4330米" },
      { name: "拉孜县", value: "4012米" },
      { name: "昂仁县", value: "4320米" },
      { name: "江孜县", value: "约4000米" },
      { name: "白朗县", value: "平均4200米" },
      { name: "聂拉木县", value: "4300米" },
      { name: "昂仁县", value: "4320米" },
      { name: "岗巴县", value: "4700米以上" },
      { name: "定结县", value: "2500-4700米" },
      { name: "定日县", value: "平均5000米。" },
      { name: "吉隆县", value: "4200米" },
      { name: "萨嘎县", value: "4487米" },
      { name: "仲巴县", value: "4772米" },
      { name: "南木林县", value: "3790米到4952米" },
      { name: "桑珠孜区", value: "3840米" },
      { name: "康马县", value: "4200-4600米" }

    ];

    // 绘制图表
    let option = {
      // backgroundColor: "#fff",
      tooltip: {
        // 鼠标是否可以进入悬浮框
        show: true,
        confine: true,
        enterable: true,
        // 触发方式 mousemove, click, none, mousemove|click
        triggerOn: 'mousemove',
        // item 图形触发, axis 坐标轴触发, none 不触发
        trigger: 'item',
        // 浮层隐藏的延迟
        hideDelay: 100,
        // 背景色
        backgroundColor: 'rgba(110, 110, 110,.5)',
        formatter: function (params) {
          const altitudeMap = {
            '亚东县': '2945米',
            '仁布县': '3950米',
            '谢通门县': '4008米',
            '萨迦县': '4330米',
            '拉孜县': '4012米',
            '昂仁县': '4320米',
            '江孜县': '约4000米',
            '白朗县': '平均4200米',
            '聂拉木县': '4300米',
            '岗巴县': '4700米以上',
            '定结县': '2500-4700米',
            '定日县': '平均5000米',
            '吉隆县': '4200米',
            '萨嘎县': '4487米',
            '仲巴县': '4772米',
            '南木林县': '3790米到4952米',
            '桑珠孜区': '3840米',
            '康马县': '4200-4600米',
          };

          return `
            <div style="background-color: #ffffff;box-shadow: 0px 0px 5px rgba(0, 0, 0, 0.3);padding: 20px;border-radius: 5px;font-size: 36px;color: #333;z-index: 1000;border-color:#333">
              <div style="font-weight: bold;margin-bottom: 30px;">${params.name}</div>
              <div>海拔:${altitudeMap[params.name] ? altitudeMap[params.name] : '未知'}</div>
            </div>
          `
        }
      },
      geo3D: {
        show: true,
        map: "centerMap",
        left: "4%",   //偏移量调整
        top: "5%",  //偏移量调整
        roam: true,
        zoom: 10,
        regionHeight: 5,
        label: {
          show: true,
          distance: 200,
          borderRadius: 0,
          distanca: 0,
          fontSize: 30,
          color: "#ffffff", // 地图初始化区域字体颜色
          borderWidth: 0,
          borderColor: '#ffffff'
        },
        itemStyle: {
          // 三维地理坐标系组件 中三维图形的视觉属性,包括颜色,透明度,描边等。
          color: "#271f71", // 地图板块的颜色
          fontSize: 30,
          opacity: 1, // 图形的不透明度 [ default: 1 ]
          borderWidth: 10, // (地图板块间的分隔线)图形描边的宽度。加上描边后可以更清晰的区分每个区域   [ default: 0 ]
          borderColor: "#6a63f4", // 图形描边的颜色。[ default: #333 ]
        },
        emphasis: {
          label: {
            show: true,
            color: "#000000", //悬浮字体颜色
            fontSize: 38,
          },
          itemStyle: {
            color: "#e2e1e1",
            opacity: 1,
          },
        },
        // shading: "color",
        light: {
          // 光照阴影
          main: {
            color: "#FFFFFF", // 光照颜色
            intensity: 2, // 光照强度
            shadowQuality: "light", // 阴影亮度
            shadow: true, // 是否显示阴影
            alpha: 50,
            beta: 10,
          },
        },
        regions: [],
        viewControl: {
          "projection": "perspective",
          "autoRotate": false,
          "autoRotateAfterStill": 3,
          "distance": 100.1931248935421,  //默认比例
          "alpha": 83.592048936336816,
          "beta": 0.48683006219769,
          "minAlpha": 5,
          "maxAlpha": 40,
          "minBeta": -1036800,
          "maxBeta": 1036800,
          "animation": true,
          "animationDurationUpdate": 1000,
          "animationEasingUpdate": "cubicInOut",
          "orthographicSize": 60,
          "autoRotateDirection": "cw",
          "autoRotateSpeed": 10,
          "damping": 0.8,
          "rotateSensitivity": 1,
          "zoomSensitivity": 1,
          "panSensitivity": 1,
          "panMouseButton": "middle",
          "rotateMouseButton": "left",
          "minDistance": 40,
          "maxDistance": 400,
          "maxOrthographicSize": 400,
          "minOrthographicSize": 20,
          "center": [
            0,
            0,
            0, 0
          ]
        },
      },
      series: [
        {
          type: "map3D", // 加载series数据
          seriesIndex: 0, // 第一个系列

          map: "centerMap",
          regionHeight: 0,
          boxHeight: 500,
          // left: 0,
          left: "4%",   //偏移量调整
          top: "5%",  //偏移量调整
          itemStyle: {
            // 三维地理坐标系组件 中三维图形的视觉属性,包括颜色,透明度,描边等。
            color: "rgba(37, 37, 38,1)", // 地图板块的颜色
            opacity: 0, // 图形的不透明度 [ default: 1 ]
            borderWidth: 0, // (地图板块间的分隔线)图形描边的宽度。加上描边后可以更清晰的区分每个区域   [ default: 0 ]
            borderColor: "#69E8F5", // 图形描边的颜色。[ default: #333 ]
          },

          label: {
            show: true,
            color: "#FFFFFF",
          },
          regions: [],
          zlevel: 5,
          viewControl: {
            "projection": "perspective",
            "autoRotate": false,
            "autoRotateAfterStill": 3,
            "distance": 100.1931248935421,  //默认比例
            "alpha": 83.592048936336816,
            "beta": 0.48683006219769,
            "minAlpha": 5,
            "maxAlpha": 40,
            "minBeta": -1036800,
            "maxBeta": 1036800,
            "animation": true,
            "animationDurationUpdate": 1000,
            "animationEasingUpdate": "cubicInOut",
            "orthographicSize": 60,
            "autoRotateDirection": "cw",
            "autoRotateSpeed": 10,
            "damping": 0.8,
            "rotateSensitivity": 1,
            "zoomSensitivity": 1,
            "panSensitivity": 1,
            "panMouseButton": "middle",
            "rotateMouseButton": "left",
            "minDistance": 40,
            "maxDistance": 400,
            "maxOrthographicSize": 400,
            "minOrthographicSize": 20,
            "center": [
              0,
              -5,
              0,
            ]
          },
        },
        {
          type: "scatter3D",

          coordinateSystem: "geo3D",
          data: [],
          symbol: "pin",
          symbolSize: 20,
          animation: true,
          animationDurationUpdate: 500,
          geo3DIndex: 0,
          silent: false,
          itemStyle: {
            opacity: 1,
            width: 1,
          },
          shading: "lambert",
          label: {
            show: false,
            position: "right",
            distance: 200, // 距离图形元素的距离
            color: "#ff0000",
            backgroundColor: "rgba(255, 255, 255, 0)",
            rich: {
              get: {
                color: "#00E3FF",
                lineHeight: 12,
              },
              set: {
                color: "#FFF100",
                lineHeight: 12,
              },
              date11: {
                color: "#FFFFFF",
                lineHeight: 12,
              },
            },
            zlevel: 6,
          },
          emphasis: {
            itemStyle: {
              color: "#FFF200",
            },
            label: {
              show: false,
            },
          },
          zlevel: 6,
        },
      ],
    };
    // myChart.showLoading();

    echarts.registerMap('centerMap', geoJson);
    // myChart.hideLoading();

    var mapFeatures = echarts.getMap("centerMap").geoJson.features;
    var geoCoordMap = {};
    mapFeatures.forEach(function (v) {
      // v.properties.center = _this.convertCoord(v.properties.center)
      // 地区名称
      var name = v.properties.name;
      // 地区经纬度
      geoCoordMap[name] = v.properties.center;


    });
    let currentIdx = -1;
    function highlightNext() {
      if (currentIdx++ >= 0) {
        // 防止下标增加到超过区域数组长度
        currentIdx %= mapFeatures.length;
      }
      highlightRegion(currentIdx) // 此处的currentIdx经过if判断,已经+1了
      setTimeout(highlightNext, 5000);
    }

    function highlightRegion(index) { // 高亮地图区域,改变对应的散点样式
      let regionName = mapFeatures[index].properties.name; // 高亮的区名

      option.geo3D.regions = [ // 高亮3D地图对应的区块
        {
          name: regionName,
          label: {
            show: true,
            color: "##000000",
          },
          itemStyle: {
            color: "#ffffff",
            opacity: 1,
          }
        }
      ];

      // 当前高亮区域有散点,需删除stroke动效中的该条数据并在fill动效中增加该条数据
      option.series[0].data = scatterData.filter(item => item.name !== regionName); // stroke散点数据
      option.series[1].data = scatterData.filter(item => item.name === regionName); // fill散点数据

      myChart.setOption(option);
      myChart.dispatchAction({ // 触发散点高亮事件,改变标签样式
        type: 'showTip',
        seriesIndex: 1, // series中的第二个图层(fill散点图层)
        dataIndex: 0 // 高亮第一条数据,由于fill散点图层只有一条数据,这里可以不指定
      });
      myChart.dispatchAction({
        type: 'highlight',
        seriesIndex: 0,
        dataIndex: 0
      });
      // 显示弹框
      myChart.dispatchAction({
        type: 'showTip',
        seriesIndex: 0,
        dataIndex: 0
      });
      // myChart.on('mouseover', () => {
      //   console.log('mouseover')
      //   // 停止定时器,清除之前的高亮
      //   clearInterval(this.mTime)
      //   this.mTime = ''
      //   myChart.dispatchAction({
      //     type: 'downplay',
      //     seriesIndex: 0,
      //     dataIndex: this.dataIndex
      //   })
      // })
    }


    myChart.setOption(option);
    highlightNext()


    // this.mapActive(myChart)


  }
}
这样就生成了一个3d地图,地图轮播效果
完整代码:
<template>
  <div id="hello">
  </div>
</template>


<script>
import * as echarts from 'echarts';
import geoJson from "../assets/mapJSon/rkz.json"
import coordtransform from 'coordtransform'
export default {
  name: 'MapDemo',
  data() {
    return {
      dataIndex: 0,
      mTime:null
    }
  },
  props: {
    msg: String
  },
  methods: {
    convertCoord(coord) {
      const gcj02 = coordtransform.wgs84togcj02(coord[0], coord[1])
      const bd09 = coordtransform.gcj02tobd09(gcj02[0], gcj02[1])
      return bd09
    },


  },
  mounted() {
    // 基于准备好的dom,初始化echarts实例


    var myChart = echarts.init(document.getElementById('hello'));

    var scatterData = [
      { name: "亚东县", value: "2945米" },
      { name: "仁布县", value: "3950米" },
      { name: "谢通门县", value: "4008米" },
      { name: "萨迦县", value: "4330米" },
      { name: "拉孜县", value: "4012米" },
      { name: "昂仁县", value: "4320米" },
      { name: "江孜县", value: "约4000米" },
      { name: "白朗县", value: "平均4200米" },
      { name: "聂拉木县", value: "4300米" },
      { name: "昂仁县", value: "4320米" },
      { name: "岗巴县", value: "4700米以上" },
      { name: "定结县", value: "2500-4700米" },
      { name: "定日县", value: "平均5000米。" },
      { name: "吉隆县", value: "4200米" },
      { name: "萨嘎县", value: "4487米" },
      { name: "仲巴县", value: "4772米" },
      { name: "南木林县", value: "3790米到4952米" },
      { name: "桑珠孜区", value: "3840米" },
      { name: "康马县", value: "4200-4600米" }

    ];

    // 绘制图表
    let option = {
      // backgroundColor: "#fff",
      tooltip: {
        // 鼠标是否可以进入悬浮框
        show: true,
        confine: true,
        enterable: true,
        // 触发方式 mousemove, click, none, mousemove|click
        triggerOn: 'mousemove',
        // item 图形触发, axis 坐标轴触发, none 不触发
        trigger: 'item',
        // 浮层隐藏的延迟
        hideDelay: 100,
        // 背景色
        backgroundColor: 'rgba(110, 110, 110,.5)',
        formatter: function (params) {
          const altitudeMap = {
            '亚东县': '2945米',
            '仁布县': '3950米',
            '谢通门县': '4008米',
            '萨迦县': '4330米',
            '拉孜县': '4012米',
            '昂仁县': '4320米',
            '江孜县': '约4000米',
            '白朗县': '平均4200米',
            '聂拉木县': '4300米',
            '岗巴县': '4700米以上',
            '定结县': '2500-4700米',
            '定日县': '平均5000米',
            '吉隆县': '4200米',
            '萨嘎县': '4487米',
            '仲巴县': '4772米',
            '南木林县': '3790米到4952米',
            '桑珠孜区': '3840米',
            '康马县': '4200-4600米',
          };

          return `
            <div style="background-color: #ffffff;box-shadow: 0px 0px 5px rgba(0, 0, 0, 0.3);padding: 20px;border-radius: 5px;font-size: 36px;color: #333;z-index: 1000;border-color:#333">
              <div style="font-weight: bold;margin-bottom: 30px;">${params.name}</div>
              <div>海拔:${altitudeMap[params.name] ? altitudeMap[params.name] : '未知'}</div>
            </div>
          `
        }
      },
      geo3D: {
        show: true,
        map: "centerMap",
        left: "4%",   //偏移量调整
        top: "5%",  //偏移量调整
        roam: true,
        zoom: 10,
        regionHeight: 5,
        label: {
          show: true,
          distance: 200,
          borderRadius: 0,
          distanca: 0,
          fontSize: 30,
          color: "#ffffff", // 地图初始化区域字体颜色
          borderWidth: 0,
          borderColor: '#ffffff'
        },
        itemStyle: {
          // 三维地理坐标系组件 中三维图形的视觉属性,包括颜色,透明度,描边等。
          color: "#271f71", // 地图板块的颜色
          fontSize: 30,
          opacity: 1, // 图形的不透明度 [ default: 1 ]
          borderWidth: 10, // (地图板块间的分隔线)图形描边的宽度。加上描边后可以更清晰的区分每个区域   [ default: 0 ]
          borderColor: "#6a63f4", // 图形描边的颜色。[ default: #333 ]
        },
        emphasis: {
          label: {
            show: true,
            color: "#000000", //悬浮字体颜色
            fontSize: 38,
          },
          itemStyle: {
            color: "#e2e1e1",
            opacity: 1,
          },
        },
        // shading: "color",
        light: {
          // 光照阴影
          main: {
            color: "#FFFFFF", // 光照颜色
            intensity: 2, // 光照强度
            shadowQuality: "light", // 阴影亮度
            shadow: true, // 是否显示阴影
            alpha: 50,
            beta: 10,
          },
        },
        regions: [],
        viewControl: {
          "projection": "perspective",
          "autoRotate": false,
          "autoRotateAfterStill": 3,
          "distance": 100.1931248935421,  //默认比例
          "alpha": 83.592048936336816,
          "beta": 0.48683006219769,
          "minAlpha": 5,
          "maxAlpha": 40,
          "minBeta": -1036800,
          "maxBeta": 1036800,
          "animation": true,
          "animationDurationUpdate": 1000,
          "animationEasingUpdate": "cubicInOut",
          "orthographicSize": 60,
          "autoRotateDirection": "cw",
          "autoRotateSpeed": 10,
          "damping": 0.8,
          "rotateSensitivity": 1,
          "zoomSensitivity": 1,
          "panSensitivity": 1,
          "panMouseButton": "middle",
          "rotateMouseButton": "left",
          "minDistance": 40,
          "maxDistance": 400,
          "maxOrthographicSize": 400,
          "minOrthographicSize": 20,
          "center": [
            0,
            0,
            0, 0
          ]
        },
      },
      series: [
        {
          type: "map3D", // 加载series数据
          seriesIndex: 0, // 第一个系列

          map: "centerMap",
          regionHeight: 0,
          boxHeight: 500,
          // left: 0,
          left: "4%",   //偏移量调整
          top: "5%",  //偏移量调整
          itemStyle: {
            // 三维地理坐标系组件 中三维图形的视觉属性,包括颜色,透明度,描边等。
            color: "rgba(37, 37, 38,1)", // 地图板块的颜色
            opacity: 0, // 图形的不透明度 [ default: 1 ]
            borderWidth: 0, // (地图板块间的分隔线)图形描边的宽度。加上描边后可以更清晰的区分每个区域   [ default: 0 ]
            borderColor: "#69E8F5", // 图形描边的颜色。[ default: #333 ]
          },

          label: {
            show: true,
            color: "#FFFFFF",
          },
          regions: [],
          zlevel: 5,
          viewControl: {
            "projection": "perspective",
            "autoRotate": false,
            "autoRotateAfterStill": 3,
            "distance": 100.1931248935421,  //默认比例
            "alpha": 83.592048936336816,
            "beta": 0.48683006219769,
            "minAlpha": 5,
            "maxAlpha": 40,
            "minBeta": -1036800,
            "maxBeta": 1036800,
            "animation": true,
            "animationDurationUpdate": 1000,
            "animationEasingUpdate": "cubicInOut",
            "orthographicSize": 60,
            "autoRotateDirection": "cw",
            "autoRotateSpeed": 10,
            "damping": 0.8,
            "rotateSensitivity": 1,
            "zoomSensitivity": 1,
            "panSensitivity": 1,
            "panMouseButton": "middle",
            "rotateMouseButton": "left",
            "minDistance": 40,
            "maxDistance": 400,
            "maxOrthographicSize": 400,
            "minOrthographicSize": 20,
            "center": [
              0,
              -5,
              0,
            ]
          },
        },
        {
          type: "scatter3D",

          coordinateSystem: "geo3D",
          data: [],
          symbol: "pin",
          symbolSize: 20,
          animation: true,
          animationDurationUpdate: 500,
          geo3DIndex: 0,
          silent: false,
          itemStyle: {
            opacity: 1,
            width: 1,
          },
          shading: "lambert",
          label: {
            show: false,
            position: "right",
            distance: 200, // 距离图形元素的距离
            color: "#ff0000",
            backgroundColor: "rgba(255, 255, 255, 0)",
            rich: {
              get: {
                color: "#00E3FF",
                lineHeight: 12,
              },
              set: {
                color: "#FFF100",
                lineHeight: 12,
              },
              date11: {
                color: "#FFFFFF",
                lineHeight: 12,
              },
            },
            zlevel: 6,
          },
          emphasis: {
            itemStyle: {
              color: "#FFF200",
            },
            label: {
              show: false,
            },
          },
          zlevel: 6,
        },
      ],
    };
    // myChart.showLoading();

    echarts.registerMap('centerMap', geoJson);
    // myChart.hideLoading();

    var mapFeatures = echarts.getMap("centerMap").geoJson.features;
    var geoCoordMap = {};
    mapFeatures.forEach(function (v) {
      // v.properties.center = _this.convertCoord(v.properties.center)
      // 地区名称
      var name = v.properties.name;
      // 地区经纬度
      geoCoordMap[name] = v.properties.center;


    });
    let currentIdx = -1;
    function highlightNext() {
      if (currentIdx++ >= 0) {
        // 防止下标增加到超过区域数组长度
        currentIdx %= mapFeatures.length;
      }
      highlightRegion(currentIdx) // 此处的currentIdx经过if判断,已经+1了
      setTimeout(highlightNext, 5000);
    }

    function highlightRegion(index) { // 高亮地图区域,改变对应的散点样式
      let regionName = mapFeatures[index].properties.name; // 高亮的区名

      option.geo3D.regions = [ // 高亮3D地图对应的区块
        {
          name: regionName,
          label: {
            show: true,
            color: "##000000",
          },
          itemStyle: {
            color: "#ffffff",
            opacity: 1,
          }
        }
      ];

      // 当前高亮区域有散点,需删除stroke动效中的该条数据并在fill动效中增加该条数据
      option.series[0].data = scatterData.filter(item => item.name !== regionName); // stroke散点数据
      option.series[1].data = scatterData.filter(item => item.name === regionName); // fill散点数据

      myChart.setOption(option);
      myChart.dispatchAction({ // 触发散点高亮事件,改变标签样式
        type: 'showTip',
        seriesIndex: 1, // series中的第二个图层(fill散点图层)
        dataIndex: 0 // 高亮第一条数据,由于fill散点图层只有一条数据,这里可以不指定
      });
      myChart.dispatchAction({
        type: 'highlight',
        seriesIndex: 0,
        dataIndex: 0
      });
      // 显示弹框
      myChart.dispatchAction({
        type: 'showTip',
        seriesIndex: 0,
        dataIndex: 0
      });
      // myChart.on('mouseover', () => {
      //   console.log('mouseover')
      //   // 停止定时器,清除之前的高亮
      //   clearInterval(this.mTime)
      //   this.mTime = ''
      //   myChart.dispatchAction({
      //     type: 'downplay',
      //     seriesIndex: 0,
      //     dataIndex: this.dataIndex
      //   })
      // })
    }


    myChart.setOption(option);
    highlightNext()


    // this.mapActive(myChart)


  }
}
</script>

<style scoped>
#hello {
  position: absolute;
  top: 50%;
  left: 48%;
  width: 2604px;
  height: 1700px;
  z-index: 9999;
  /* border: 20px solid red;s */
  /* border-color: rgba(0, 0, 0, 0) !important; */
  transform: translate(-50%, -50%);
}
</style>
总结
在网上寻找适合自己的方案总是非常耗费精力和时间的。但是,我克服了这些困难,经过自己的研究和实践,最终终于做出来了自己想要的结果。
作为一名程序员,我觉得最重要的是保持不断探索、学习和尝试的精神。当我遇到问题时,我会尝试各种可能的解决方案,来找到最适合我自己的答案。这样不仅可以提升自己的技能水平,也可以增强自己的解决问题的能力。
通过自己的努力和研究,我创建了自己想要的效果,这让我非常自豪和满足。我希望我能够将这个过程记录下来,与其他人分享,让更多的人从中受益。