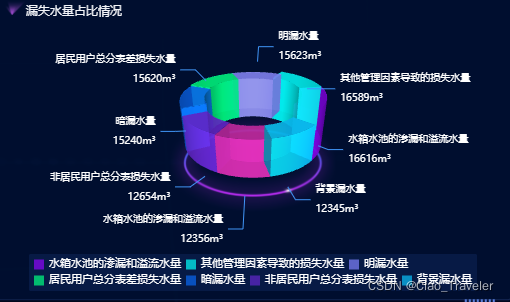
效果图
需要下载echarts、echarts-gl、版本
实现代码
import * as echarts from "echarts";
import React from "react";
import "echarts-gl";
import "./index.less";
const optionData = [{


  name: "明漏水量",
  value: 15623,
}, {


  name: "水箱水池的渗漏和溢流水量",
  value: 12356,
}, {


  name: "水箱水池的渗漏和溢流水量",
  value: 16616,
}, {


  name: "暗漏水量",
  value: 15240,
},
{


  name: "背景漏水量",
  value: 12345,
},
{


  name: "其他管理因素导致的损失水量",
  value: 16589,
}, {


  name: "居民用户总分表差损失水量",
  value: 15620,
}, {


  name: "非居民用户总分表损失水量",
  value: 12654,
},
];
const colorLisst = ["rgba(128, 129, 255,.7)", "rgba(194, 41, 158, .7)", "rgba(143, 4, 253, .7)", "rgba(9, 102, 242, .7)", "rgba(10, 193, 251, .7)", "rgba(2, 255, 253, .7)", "rgba(0, 255, 129, .7)", "rgba(99, 38, 204, .7)"];

class LossPipe extends React.Component {


  constructor(props) {


    super(props);
    this.state = {


    };
    this.Chart_dom = React.createRef();
    this.Chart_init = null;
  }
  componentDidMount() {


    optionData.map((item, index) => {


      item.itemStyle = {


        color: colorLisst[index]
      };
    });
    this.init();
  }

  init = () => {


    //构建3d饼状图
    let myChart = echarts.init(this.Chart_dom.current);
    // 传入数据生成 option
    this.option = this.getPie3D(optionData, 0.8);
    // myChart.setOption(this.option);
    //是否需要label指引线,如果要就添加一个透明的2d饼状图并调整角度使得labelLine和3d的饼状图对齐,并再次setOption
    this.option.series.push({


      name: "pie2d",
      type: "pie",
      labelLine: {


        // length: 15,
        // length2: 10,
        lineStyle: {


          color: "#4095f7",
          with: 2,

        },
      },
      label: {


        opacity: 1,
        fontSize: "10px",
        lineHeight: 20
      },
      startAngle: -40, //起始角度,支持范围[0, 360]。
      clockwise: false,//饼图的扇区是否是顺时针排布。上述这两项配置主要是为了对齐3d的样式
      radius: ["20%", "50%"],
      center: ["50%", "40%"],
      data: optionData,
      itemStyle: {


        opacity: 0
      }
    });
    myChart.setOption(this.option);
    this.bindListen(myChart);
  }

  getPie3D = (pieData, internalDiameterRatio) => {


    //internalDiameterRatio:透明的空心占比
    let that = this;
    let series = [];
    let sumValue = 0;
    let startValue = 0;
    let endValue = 0;
    let legendData = [];
    let legendBfb = [];
    let k = 1 - internalDiameterRatio;
    pieData.sort((a, b) => {


      return (b.value - a.value);
    });
    // 为每一个饼图数据,生成一个 series-surface 配置
    for (let i = 0; i < pieData.length; i++) {


      sumValue += pieData[i].value;
      let seriesItem = {


        name: typeof pieData[i].name === "undefined" ? `series${

      i}` : pieData[i].name,
        type: "surface",
        parametric: true,
        wireframe: {


          show: false
        },
        pieData: pieData[i],
        pieStatus: {


          selected: false,
          hovered: false,
          k: k
        },
        // center: ["50%", "100%"]
      };

      if (typeof pieData[i].itemStyle !== "undefined") {


        let itemStyle = {

    };
        itemStyle.color = typeof pieData[i].itemStyle.color !== "undefined" ? pieData[i].itemStyle.color : null;
        itemStyle.opacity = typeof pieData[i].itemStyle.opacity !== "undefined" ? pieData[i].itemStyle.opacity : null;
        seriesItem.itemStyle = itemStyle;
      }
      series.push(seriesItem);
    }

    // 使用上一次遍历时,计算出的数据和 sumValue,调用 getParametricEquation 函数,
    // 向每个 series-surface 传入不同的参数方程 series-surface.parametricEquation,也就是实现每一个扇形。
    legendData = [];
    legendBfb = [];
    for (let i = 0; i < series.length; i++) {


      endValue = startValue + series[i].pieData.value;
      series[i].pieData.startRatio = startValue / sumValue;
      series[i].pieData.endRatio = endValue / sumValue;
      series[i].parametricEquation = this.getParametricEquation(series[i].pieData.startRatio, series[i].pieData.endRatio,
        false, false, k, series[i].pieData.value);
      startValue = endValue;
      let bfb = that.fomatFloat(series[i].pieData.value / sumValue, 4);
      legendData.push({


        name: series[i].name,
        value: bfb
      });
      legendBfb.push({


        name: series[i].name,
        value: bfb
      });
    }
    let boxHeight = this.getHeight3D(series, 34);//通过传参设定3d饼/环的高度,26代表26px
    // 准备待返回的配置项,把准备好的 legendData、series 传入。
    let option = {


      legend: {


        data: legendData,
        // orient: "vertical",
        orient: "horizontal",
        bottom: 0,
        // right: 10,
        // top: 30,
        itemGap: 5,
        textStyle: {


          color: "#fff",
          fontSize: "11px",
        },
        itemWidth: 10,
        itemHeight: 10,
        borderRadius: 2,
        backgroundColor: "rgba(55,116,229,0.12)",

        show: true,
        icon: "rangle",
        // formatter: function (param) {


        //   let item = legendBfb.filter(item => item.name === param)[0];
        //   let bfs = that.fomatFloat(item.value * 100, 2) + "%";
        //   return `${item.name}  ${bfs}`;
        // },
      },
      labelLine: {


        show: true,
        lineStyle: {


          color: "#fff"
        }
      },
      label: {


        show: true,
        position: "outside",
        rich: {


          b: {


            color: "#fff",
            fontSize: "10px",
            lineHeight: 20
          },
          c: {


            fontSize: "10px",
            color: "#fff",
          },
        },
        formatter: "{b|{b}\n}{c|{c}}{b|m³}",

      },
      // backgroundColor: "#000d2d",
      tooltip: {


        formatter: params => {


          if (params.seriesName !== "mouseoutSeries" && params.seriesName !== "pie2d") {


            let bfb = ((option.series[params.seriesIndex].pieData.endRatio - option.series[params.seriesIndex].pieData.startRatio) *
              100).toFixed(2);
            return `${

      params.seriesName}<br/>` +
              `<span style="display:inline-block;margin-right:5px;border-radius:10px;width:10px;height:10px;background-color:${

      params.color};"></span>` +
              `${

      bfb}%`;
          }
        }
      },
      xAxis3D: {


        min: -1,
        max: 1
      },
      yAxis3D: {


        min: -1,
        max: 1
      },
      zAxis3D: {


        min: -1,
        max: 1
      },
      grid3D: {


        show: false,
        boxHeight: boxHeight, //圆环的高度
        top: -20,
        // left: -120,
        viewControl: {

     //3d效果可以放大、旋转等,请自己去查看官方配置
          alpha: 30, //角度
          distance: 260,//调整视角到主体的距离,类似调整zoom
          rotateSensitivity: 0, //设置为0无法旋转
          zoomSensitivity: 0, //设置为0无法缩放
          panSensitivity: 0, //设置为0无法平移
          autoRotate: false //自动旋转
        },
      },
      series: series
    };
    return option;
  };

  //获取3d丙图的最高扇区的高度
  getHeight3D = (series, height) => {


    series.sort((a, b) => {


      return (b.pieData.value - a.pieData.value);
    });
    return height * 25 / series[0].pieData.value;
  };

  // 生成扇形的曲面参数方程,用于 series-surface.parametricEquation
  getParametricEquation = (startRatio, endRatio, isSelected, isHovered, k, h) => {


    // 计算
    let midRatio = (startRatio + endRatio) / 2;
    let startRadian = startRatio * Math.PI * 2;
    let endRadian = endRatio * Math.PI * 2;
    let midRadian = midRatio * Math.PI * 2;
    // 如果只有一个扇形,则不实现选中效果。
    if (startRatio === 0 && endRatio === 1) {


      isSelected = false;
    }
    // 通过扇形内径/外径的值,换算出辅助参数 k(默认值 1/3)
    k = typeof k !== "undefined" ? k : 1 / 3;
    // 计算选中效果分别在 x 轴、y 轴方向上的位移(未选中,则位移均为 0)
    let offsetX = isSelected ? Math.cos(midRadian) * 0.1 : 0;
    let offsetY = isSelected ? Math.sin(midRadian) * 0.1 : 0;
    // 计算高亮效果的放大比例(未高亮,则比例为 1)
    let hoverRate = isHovered ? 1.05 : 1;
    // 返回曲面参数方程
    return {


      u: {


        min: -Math.PI,
        max: Math.PI * 3,
        step: Math.PI / 32
      },
      v: {


        min: 0,
        max: Math.PI * 2,
        step: Math.PI / 20
      },
      x: function (u, v) {


        if (u < startRadian) {


          return offsetX + Math.cos(startRadian) * (1 + Math.cos(v) * k) * hoverRate;
        }
        if (u > endRadian) {


          return offsetX + Math.cos(endRadian) * (1 + Math.cos(v) * k) * hoverRate;
        }
        return offsetX + Math.cos(u) * (1 + Math.cos(v) * k) * hoverRate;
      },
      y: function (u, v) {


        if (u < startRadian) {


          return offsetY + Math.sin(startRadian) * (1 + Math.cos(v) * k) * hoverRate;
        }
        if (u > endRadian) {


          return offsetY + Math.sin(endRadian) * (1 + Math.cos(v) * k) * hoverRate;
        }
        return offsetY + Math.sin(u) * (1 + Math.cos(v) * k) * hoverRate;
      },
      z: function (u, v) {


        if (u < -Math.PI * 0.5) {


          return Math.sin(u);
        }
        if (u > Math.PI * 2.5) {


          return Math.sin(u) * h * .1;
        }
        return Math.sin(v) > 0 ? 1 * h * .1 : -1;
      }
    };
  }

  fomatFloat = (num, n) => {


    var f = parseFloat(num);
    if (isNaN(f)) {


      return false;
    }
    f = Math.round(num * Math.pow(10, n)) / Math.pow(10, n); // n 幂
    var s = f.toString();
    var rs = s.indexOf(".");
    //判定如果是整数,增加小数点再补0
    if (rs < 0) {


      rs = s.length;
      s += ".";
    }
    while (s.length <= rs + n) {


      s += "0";
    }
    return s;
  }

  bindListen = (myChart) => {


    // 监听鼠标事件,实现饼图选中效果(单选),近似实现高亮(放大)效果。
    let that = this;
    let selectedIndex = "";
    let hoveredIndex = "";
    // 监听点击事件,实现选中效果(单选)
    myChart.on("click", function (params) {


      // 从 option.series 中读取重新渲染扇形所需的参数,将是否选中取反。
      let isSelected = !that.option.series[params.seriesIndex].pieStatus.selected;
      let isHovered = that.option.series[params.seriesIndex].pieStatus.hovered;
      let k = that.option.series[params.seriesIndex].pieStatus.k;
      let startRatio = that.option.series[params.seriesIndex].pieData.startRatio;
      let endRatio = that.option.series[params.seriesIndex].pieData.endRatio;
      // 如果之前选中过其他扇形,将其取消选中(对 option 更新)
      if (selectedIndex !== "" && selectedIndex !== params.seriesIndex) {


        that.option.series[selectedIndex].parametricEquation = that.getParametricEquation(that.option.series[
          selectedIndex].pieData
          .startRatio, that.option.series[selectedIndex].pieData.endRatio, false, false, k, that.option.series[
            selectedIndex].pieData
          .value);
        that.option.series[selectedIndex].pieStatus.selected = false;
      }
      // 对当前点击的扇形,执行选中/取消选中操作(对 option 更新)
      that.option.series[params.seriesIndex].parametricEquation = that.getParametricEquation(startRatio, endRatio,
        isSelected,
        isHovered, k, that.option.series[params.seriesIndex].pieData.value);
      that.option.series[params.seriesIndex].pieStatus.selected = isSelected;
      // 如果本次是选中操作,记录上次选中的扇形对应的系列号 seriesIndex
      selectedIndex = isSelected ? params.seriesIndex : null;
      // isSelected ? selectedIndex = params.seriesIndex : null;
      // 使用更新后的 option,渲染图表
      myChart.setOption(that.option);
    });
    // 监听 mouseover,近似实现高亮(放大)效果
    myChart.on("mouseover", function (params) {


      // 准备重新渲染扇形所需的参数
      let isSelected;
      let isHovered;
      let startRatio;
      let endRatio;
      let k;
      // 如果触发 mouseover 的扇形当前已高亮,则不做操作
      if (hoveredIndex === params.seriesIndex) {


        return;
        // 否则进行高亮及必要的取消高亮操作
      } else {


        // 如果当前有高亮的扇形,取消其高亮状态(对 option 更新)
        if (hoveredIndex !== "") {


          // 从 option.series 中读取重新渲染扇形所需的参数,将是否高亮设置为 false。
          isSelected = that.option.series[hoveredIndex].pieStatus.selected;
          isHovered = false;
          startRatio = that.option.series[hoveredIndex].pieData.startRatio;
          endRatio = that.option.series[hoveredIndex].pieData.endRatio;
          k = that.option.series[hoveredIndex].pieStatus.k;
          // 对当前点击的扇形,执行取消高亮操作(对 option 更新)
          that.option.series[hoveredIndex].parametricEquation = that.getParametricEquation(startRatio, endRatio,
            isSelected,
            isHovered, k, that.option.series[hoveredIndex].pieData.value);
          that.option.series[hoveredIndex].pieStatus.hovered = isHovered;
          // 将此前记录的上次选中的扇形对应的系列号 seriesIndex 清空
          hoveredIndex = "";
        }
        // 如果触发 mouseover 的扇形不是透明圆环,将其高亮(对 option 更新)
        if (params.seriesName !== "mouseoutSeries" && params.seriesName !== "pie2d") {


          // 从 option.series 中读取重新渲染扇形所需的参数,将是否高亮设置为 true。
          isSelected = that.option.series[params.seriesIndex].pieStatus.selected;
          isHovered = true;
          startRatio = that.option.series[params.seriesIndex].pieData.startRatio;
          endRatio = that.option.series[params.seriesIndex].pieData.endRatio;
          k = that.option.series[params.seriesIndex].pieStatus.k;
          // 对当前点击的扇形,执行高亮操作(对 option 更新)
          that.option.series[params.seriesIndex].parametricEquation = that.getParametricEquation(startRatio, endRatio,
            isSelected, isHovered, k, that.option.series[params.seriesIndex].pieData.value + 5);
          that.option.series[params.seriesIndex].pieStatus.hovered = isHovered;
          // 记录上次高亮的扇形对应的系列号 seriesIndex
          hoveredIndex = params.seriesIndex;
        }
        // 使用更新后的 option,渲染图表
        myChart.setOption(that.option);
      }
    });
    // 修正取消高亮失败的 bug
    myChart.on("globalout", function () {


      // 准备重新渲染扇形所需的参数
      let isSelected;
      let isHovered;
      let startRatio;
      let endRatio;
      let k;
      if (hoveredIndex !== "") {


        // 从 option.series 中读取重新渲染扇形所需的参数,将是否高亮设置为 true。
        isSelected = that.option.series[hoveredIndex].pieStatus.selected;
        isHovered = false;
        k = that.option.series[hoveredIndex].pieStatus.k;
        startRatio = that.option.series[hoveredIndex].pieData.startRatio;
        endRatio = that.option.series[hoveredIndex].pieData.endRatio;
        // 对当前点击的扇形,执行取消高亮操作(对 option 更新)
        that.option.series[hoveredIndex].parametricEquation = that.getParametricEquation(startRatio, endRatio,
          isSelected,
          isHovered, k, that.option.series[hoveredIndex].pieData.value);
        that.option.series[hoveredIndex].pieStatus.hovered = isHovered;
        // 将此前记录的上次选中的扇形对应的系列号 seriesIndex 清空
        hoveredIndex = "";
      }
      // 使用更新后的 option,渲染图表
      myChart.setOption(that.option);
    });
  }

  render() {


    return (
      <div style={

    {

     width: "496px", height: "270px", position: "relative" }}>
        <div ref={

    this.Chart_dom} style={

    {

     width: "100%", height: "100%", zIndex: "5" }}> </div>
        <div className="bg"></div>
      </div>
    );
  }
}

export default LossPipe;
背景样式
.bg{


  position: absolute;
    bottom: 77px;
    left: 51%;
    z-index: 0;
    width: 187px;
    height: 103px;
    background: url("../../../assets/supply/bglight.png") no-repeat center;//红色的光圈
    background-size: 100% 100%;
    transform: translateX(-50%);
}
参考链接:https://www.cnblogs.com/KaypoGeng/p/14338434.html