版权声明:本文为博主原创文章,未经博主允许不得转载。如有问题,欢迎指正。 https://blog.csdn.net/kellyroslyn/article/details/88901167
此博文仅为个人学习笔记,仅供个人使用。
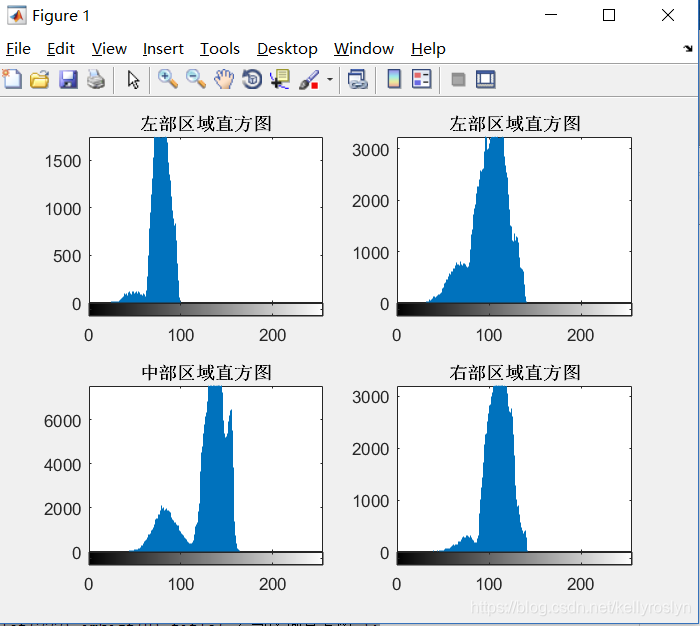
1.如何在一个figure里面画多个子图。
 %subplot(x,y,n)x表示显示的行数,y表示列数,n表示第几幅图片
figure,subplot(221),imhist(P),title('左部区域直方图');  % define figure
subplot(222),imhist(U),title('左部区域直方图');
subplot(223),imhist(D),title('中部区域直方图');
subplot(224),imhist(T),title('右部区域直方图');
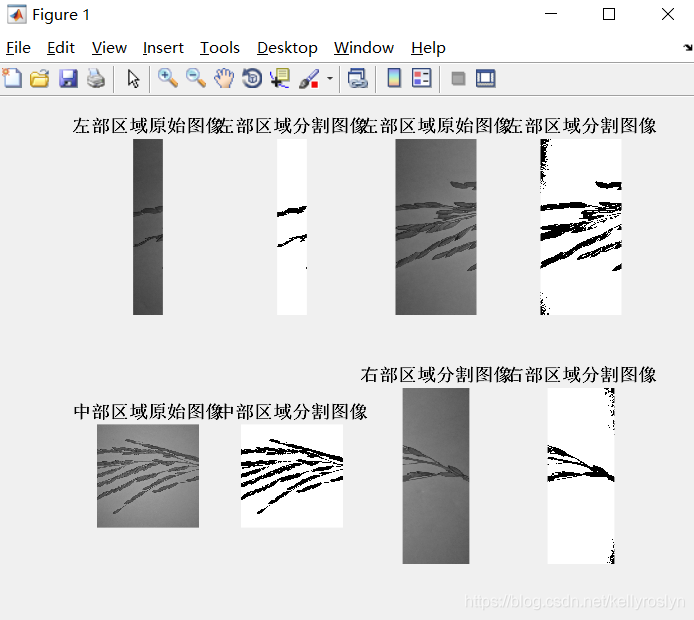
%2行4列的图片,一共8幅图。
figure,subplot(241),imshow(P),title('左部区域原始图像');%321是3行2列矩阵第1幅图
subplot(242),imshow(L0),title('左部区域分割图像');
subplot(243),imshow(U),title('左部区域原始图像');%321是3行2列矩阵第1幅图
subplot(244),imshow(L1),title('左部区域分割图像');
subplot(245),imshow(D),title('中部区域原始图像');
subplot(246),imshow(L2),title('中部区域分割图像');
subplot(247),imshow(T),title('右部区域分割图像');
subplot(248),imshow(L3),title('右部区域分割图像');
2.多个figure画多个子图
figure(1);         % 第一个子图
plot(...);
figure(2);         % 第二个子图
plot(...);
figure(3);
plot(...);
figure(4);
plot(...);