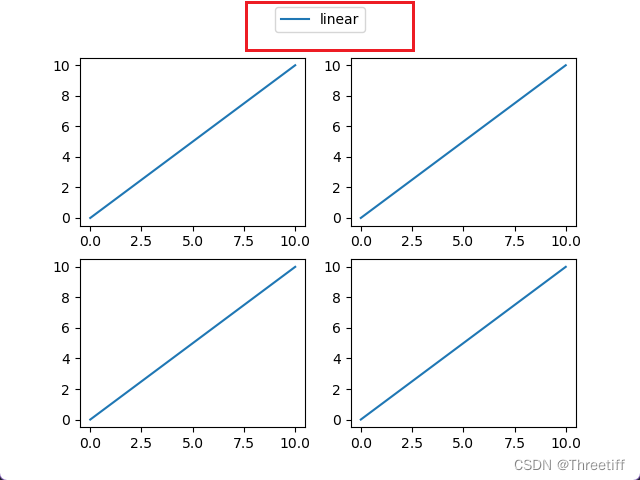
1 所有子图的图例相同
**利用函数fig.axe.get_legend_handles_labels()得到图的line和label
import matplotlib.pyplot as plt

fig = plt.figure()
axes = fig.subplots(nrows=2, ncols=2)

for ax in fig.axes:
    ax.plot([0, 10], [0, 10], label='linear')
# 使用最后一个子图的图例
lines, labels = fig.axes[-1].get_legend_handles_labels()
fig.legend(lines, labels, loc = 'upper center') # 图例的位置,bbox_to_anchor=(0.5, 0.92),
plt.show()
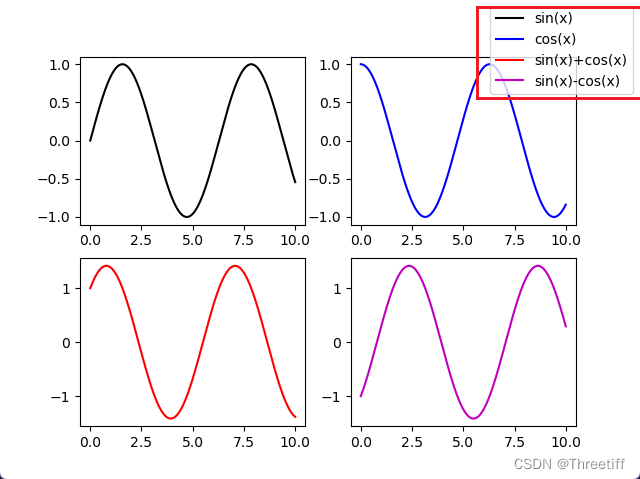
2 所有的子图图例不同
import matplotlib.pyplot as plt
import numpy as np

x = np.linspace(0, 10, 501)

fig = plt.figure()
axes = fig.subplots(nrows=2, ncols=2)
axes[0, 0].plot(x,np.sin(x),color = 'k',label="sin(x)")
axes[0, 1].plot(x,np.cos(x),color = 'b',label="cos(x)")
axes[1, 0].plot(x,np.sin(x) + np.cos(x),color = 'r',label="sin(x)+cos(x)")
axes[1, 1].plot(x,np.sin(x) - np.cos(x),color = 'm',label="sin(x)-cos(x)")

lines = []
labels = []
# 利用循环得到每一个子图的图例
for ax in fig.axes:
    axLine, axLabel = ax.get_legend_handles_labels()
    lines.extend(axLine)
    labels.extend(axLabel)

fig.legend(lines, labels, loc = 'upper right')  # 图例的位置,bbox_to_anchor=(0.5, 0.92),
plt.show()
学习链接