版权声明:本文为博主原创文章,未经博主允许不得转载。 https://blog.csdn.net/tengweitw/article/details/78697056
十月底,投完会议之后,便对科研写作方面遇到的问题进行了探索。问题主要有:
问题:
- 文献管理问题:在写论文的过程中,经常要引用他人文献,这时需要费时去寻找。另一方面,有时想要查看曾经读到的某篇文章提到的方法, 也需要去耗时去寻找。
- 画图问题:怎样画出好看的图?
解决方案:
- 针对问题1: 使用JabRef
- 针对问题2:使用Pgfplots
后面我将会用一系列文章来记录JabRef和Pgfplots的常用使用方法。本文介绍一下如何让多个子图共用一个图例
- Case1: 所有的子图有相同的曲线
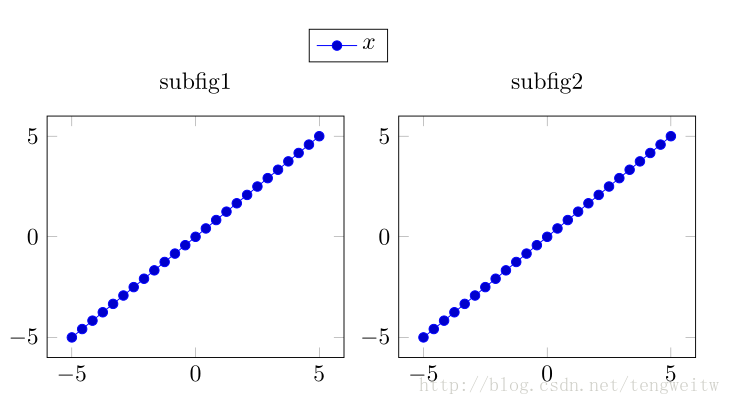
实现代码如下:
\documentclass{article}
\usepackage[dvipdfm]{graphicx}
\def\pgfsysdriver{pgfsys-dvipdfmx.def}
\usepackage{tikz}
\usepackage{pgfplots}
\pgfplotsset{width=6cm,compat=1.15}
\begin{document}
\begin{center}
\ref{named}\\%\pgfplotsplotfromname{named} instead of \ref{named} if the codes doesn't work
\begin{tikzpicture}
\begin{axis}[
legend columns=-1,%the legend are plotted horizontally
legend entries={$x$},
legend to name=named,% stored in named
title={subfig1},
]
\addplot {x};
\end{axis}
\end{tikzpicture}
\begin{tikzpicture}
\begin{axis}[title={subfig2}]
\addplot {x};
\end{axis}
\end{tikzpicture}
\end{center}
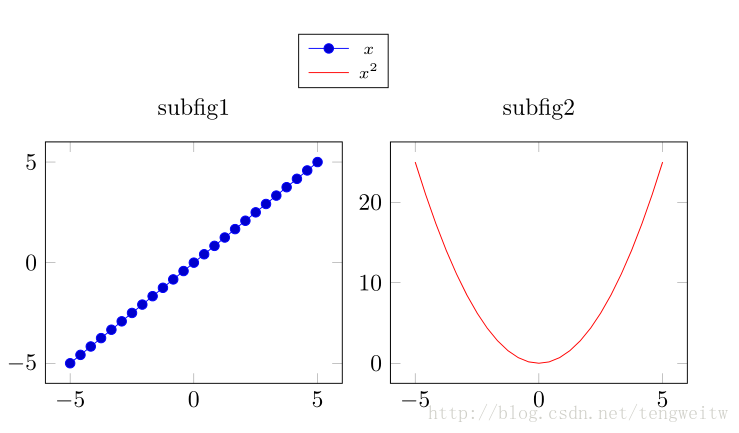
\end{document} Case2: 子图有不同的曲线
实现代码如下:
\documentclass{article}
\usepackage[dvipdfm]{graphicx}
\def\pgfsysdriver{pgfsys-dvipdfmx.def}
\usepackage{tikz}
\usepackage{pgfplots}
\pgfplotsset{width=6cm,compat=1.15}
\usetikzlibrary{matrix}
\usepgfplotslibrary{external}
\newcommand*{\refne}[1]{\tikzexternaldisable\pgfplotsplotfromname{#1}\tikzexternalenable}%avoid conflict with the packet hyperref
\begin{document}
\begin{center}
\begin{tikzpicture}
%--define the legend by ourself
  \matrix[
      matrix of nodes,
      draw,
      inner sep=0.2em,
      ampersand replacement=\&,
      font=\scriptsize,
      anchor=east
    ]
    { \refne{x}\& $x$\\
      \refne{x2}\& $x^2$\\
      };
\end{tikzpicture}\\

\begin{tikzpicture}
\begin{axis}[
legend columns=-1,%the legend are plotted horizontally
legend entries={$x$},
legend to name=named,% stored in named
title={subfig1},
]
\addplot {x};\label{x}
\end{axis}
\end{tikzpicture}
\begin{tikzpicture}
\begin{axis}[title={subfig2}]
\addplot[red] {x^2};\label{x2}
\end{axis}
\end{tikzpicture}
\end{center}
\end{document}
参考文献:
[1] pgfplots manual: http://pgfplots.sourceforge.net/pgfplots.pdf
[2]https://tex.stackexchange.com/questions/192729/pgfplots-trying-to-combine-legends
本科舍友不幸得了黑色素癌, 在此恳求大家能给予帮助,在此谢谢大家!以下是水滴筹的链接:
https://www.shuidichou.com/cf/contribute/7d975cfc-e508-4549-acb1-5a31ceb759a1?channel=wx_charity_pyq&source=7hEPKZfbC7kzc7ndTKDD6cZriDdYH4TQ&forwardFrom=5&sharedv=2008
如果各位嫌麻烦,也可以通过左下角的微信扫码进行捐款,我将悉数给予舍友。再次感谢大家的帮助!