用 matlab 画图时,发现一部分范围内,线之间贴得太近。于是想在一个图中画另外一个小图,实现局部放大的功能。
在网上众多偏方中,经过辛苦遴选与试验,发现以下的方法最为简单有效。
废话不多说,1)效果;2)一个完整的画图脚本代码 与 画图数据文件内容。
%% ----- 1 效果:
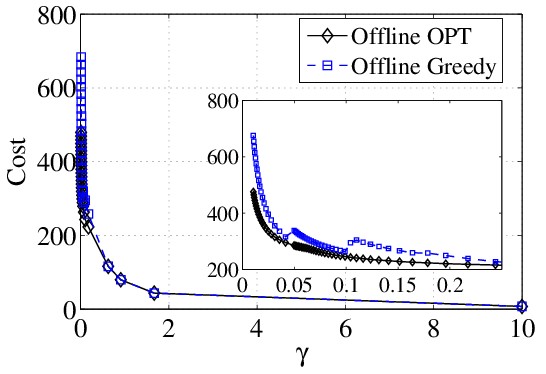
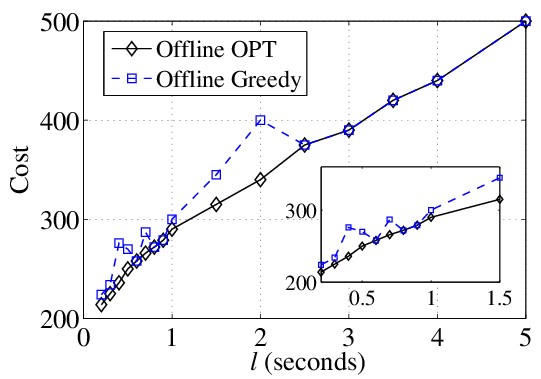
需要注意的是:小图的显示位置以及尺寸大小都是用代码来控制的,具体请研究如下区区20行代码。
%% ----- 2 Code:
clear;
% ==================================== A. Read the data :
filename = 'Cost_trace_1_TS_step.tr';
%%%% X is tsLen (\ell)
X 			= textread(filename,'%*s%*s %*s%*s %*s%*s %*s%*s  %*s%f  %*[^\n]');
OPT_C 		= textread(filename,'%*s%*s %*s%*s %*s%*s %*s%*s  %*s%*s %*s%f %*s%*s');
Greedy_C 	= textread(filename,'%*s%*s %*s%*s %*s%*s %*s%*s %*s%*s  %*s%*s %*s%f' );
% === A. Read the data :~

% ==================================== B.1 Calculate the Avg-Costs for the Big Figure :
Avg_OPT_C = [];
Avg_Greedy_C = [];

% ---- given x_axis points
X_items =[0.2,0.3,0.4,0.5,0.6,0.7,0.8,0.9,1.0,1.5,2.0,2.5,3.0,3.5,4.0,5.0];

alpha = 10;
beta = 50;

CNT = length(X_items);
for item = 1:CNT
	Val_item = X_items(item);
	idx_it = find( X == Val_item );

	% --- 1 OPT_C
	OPT_costs_its = [];
	OPT_costs_its = OPT_C( idx_it );
	Len_opt_cost_its = length(OPT_costs_its);
	Avg_OPT_C(item) = sum(OPT_costs_its) / Len_opt_cost_its;

	% --- 2 Greedy_C
	Gdy_costs_its = [];
	Gdy_costs_its = Greedy_C( idx_it );
	Len_opt_cost_its = length(Gdy_costs_its);
	Avg_Greedy_C(item) = sum(Gdy_costs_its) / Len_opt_cost_its;
end
% === B.1 Calculate the Avg-Costs for the Big Figure :~

% ==================================== B.2 Calculate the Avg-Costs for the Small Figure :
Avg_OPT_C2 = [];
Avg_Greedy_C2 = [];

%%%% X_items2 is partial tsLen (\ell)
X_items2=[ 0.2,0.3,0.4,0.5,0.6,0.7,0.8,0.9,1.0,1.5 ];
CNT2 = length(X_items2);
for item = 1:CNT2
	Val_item = X_items2(item);
	idx_it = find( X == Val_item );

	% --- 1 OPT_C
	OPT_costs_its = [];
	OPT_costs_its = OPT_C( idx_it );
	Len_opt_cost_its = length(OPT_costs_its);
	Avg_OPT_C2(item) = sum(OPT_costs_its) / Len_opt_cost_its;

	% --- 2 Greedy_C
	Gdy_costs_its = [];
	Gdy_costs_its = Greedy_C( idx_it );
	Len_opt_cost_its = length(Gdy_costs_its);
	Avg_Greedy_C2(item) = sum(Gdy_costs_its) / Len_opt_cost_its;
end
% === B.2 Calculate the Avg-Costs for the Small Figure :~

% ==================================== C. Plot ====================================
figure
TextFontSize=20;
LegendFontSize = 18;
% ------------- C.1 Plot the big one : -------------
set(0,'DefaultAxesFontName','Times',...
    'DefaultLineLineWidth',1,...
    'DefaultLineMarkerSize',8);
set(gca,'FontName','Times New Roman','FontSize',TextFontSize);
set(gcf,'Units','inches','Position',[0 0 6.0 4.0]);

	% --- 1 Avg-OPT_costs_1m
	plot(X_items, Avg_OPT_C, '-dk')
	hold on

	% --- 2 Avg-OPT_costs_2m
	plot(X_items, Avg_Greedy_C, '--sb')
	hold on

grid on
xlabel('{\it l} (seconds)')
ylabel('Cost')
hg1 = legend('Offline OPT', 'Offline Greedy',1);
set(hg1,'FontSize',LegendFontSize);
% --- C.1 Plot the big one :~

% ------------- C.2 Plot the small one : -------------
set(0,'DefaultTextFontName','Times',...
    'DefaultAxesFontName','Times',...
    'DefaultLineLineWidth',1,...
    'DefaultLineMarkerSize',4.5);

h1=axes('position',[0.55 0.245 0.31 0.3]);	% set the size of the small figure
set(h1,'FontName','Times New Roman','FontSize',16);
axis(h1);

	plot(X_items2, Avg_OPT_C2, '-dk');
	hold on
	plot(X_items2, Avg_Greedy_C2, '--sb');
	hold on
xlim([0.2 1.5]);
ylim([200 360]);
% --- C.2 Plot the small one :~
PS: 其中,数据文件的全部内容,也搬上来,为了让某些同学可以跑起来程序进行验证。
Cost_trace_1_TS_step.tr
-beta	50.000000	-alpha	10.000000	-TS_begin	0	-TS_end	118	-TS_step	0.200000	-OPT	214.000000	-Greedy	224.000000
-beta	50.000000	-alpha	10.000000	-TS_begin	0	-TS_end	79	-TS_step	0.300000	-OPT	225.000000	-Greedy	234.000000
-beta	50.000000	-alpha	10.000000	-TS_begin	0	-TS_end	60	-TS_step	0.400000	-OPT	236.000000	-Greedy	276.000000
-beta	50.000000	-alpha	10.000000	-TS_begin	0	-TS_end	48	-TS_step	0.500000	-OPT	250.000000	-Greedy	270.000000
-beta	50.000000	-alpha	10.000000	-TS_begin	0	-TS_end	40	-TS_step	0.600000	-OPT	258.000000	-Greedy	258.000000
-beta	50.000000	-alpha	10.000000	-TS_begin	0	-TS_end	35	-TS_step	0.700000	-OPT	266.000000	-Greedy	287.000000
-beta	50.000000	-alpha	10.000000	-TS_begin	0	-TS_end	31	-TS_step	0.800000	-OPT	272.000000	-Greedy	272.000000
-beta	50.000000	-alpha	10.000000	-TS_begin	0	-TS_end	27	-TS_step	0.900000	-OPT	279.000000	-Greedy	279.000000
-beta	50.000000	-alpha	10.000000	-TS_begin	0	-TS_end	25	-TS_step	1.000000	-OPT	290.000000	-Greedy	300.000000
-beta	50.000000	-alpha	10.000000	-TS_begin	0	-TS_end	17	-TS_step	1.500000	-OPT	315.000000	-Greedy	345.000000
-beta	50.000000	-alpha	10.000000	-TS_begin	0	-TS_end	13	-TS_step	2.000000	-OPT	340.000000	-Greedy	400.000000
-beta	50.000000	-alpha	10.000000	-TS_begin	0	-TS_end	11	-TS_step	2.500000	-OPT	375.000000	-Greedy	375.000000
-beta	50.000000	-alpha	10.000000	-TS_begin	0	-TS_end	9	-TS_step	3.000000	-OPT	390.000000	-Greedy	390.000000
-beta	50.000000	-alpha	10.000000	-TS_begin	0	-TS_end	8	-TS_step	3.500000	-OPT	420.000000	-Greedy	420.000000
-beta	50.000000	-alpha	10.000000	-TS_begin	0	-TS_end	7	-TS_step	4.000000	-OPT	440.000000	-Greedy	440.000000
-beta	50.000000	-alpha	10.000000	-TS_begin	0	-TS_end	6	-TS_step	5.000000	-OPT	500.000000	-Greedy	500.000000
-beta	50.000000	-alpha	10.000000	-TS_begin	0	-TS_end	5	-TS_step	6.000000	-OPT	540.000000	-Greedy	540.000000
-beta	50.000000	-alpha	10.000000	-TS_begin	0	-TS_end	5	-TS_step	7.000000	-OPT	630.000000	-Greedy	630.000000
-beta	50.000000	-alpha	10.000000	-TS_begin	0	-TS_end	4	-TS_step	8.000000	-OPT	640.000000	-Greedy	640.000000
-beta	50.000000	-alpha	10.000000	-TS_begin	0	-TS_end	4	-TS_step	9.000000	-OPT	720.000000	-Greedy	720.000000
-beta	50.000000	-alpha	10.000000	-TS_begin	0	-TS_end	4	-TS_step	10.000000	-OPT	800.000000	-Greedy	800.000000
Davy_H
2014-09-13