- #-*- coding:utf-8 -*-
- import math
- import matplotlib.pyplot as plt
- def linefit(x , y):
- N = float(len(x))
- sx,sy,sxx,syy,sxy=0,0,0,0,0
- for i in range(0,int(N)):
- sx += x[i]
- sy += y[i]
- sxx += x[i]*x[i]
- syy += y[i]*y[i]
- sxy += x[i]*y[i]
- a = (sy*sx/N -sxy)/( sx*sx/N -sxx)
- b = (sy - a*sx)/N
- r = abs(sy*sx/N-sxy)/math.sqrt((sxx-sx*sx/N)*(syy-sy*sy/N))
- return a,b,r
- if __name__ == '__main__':
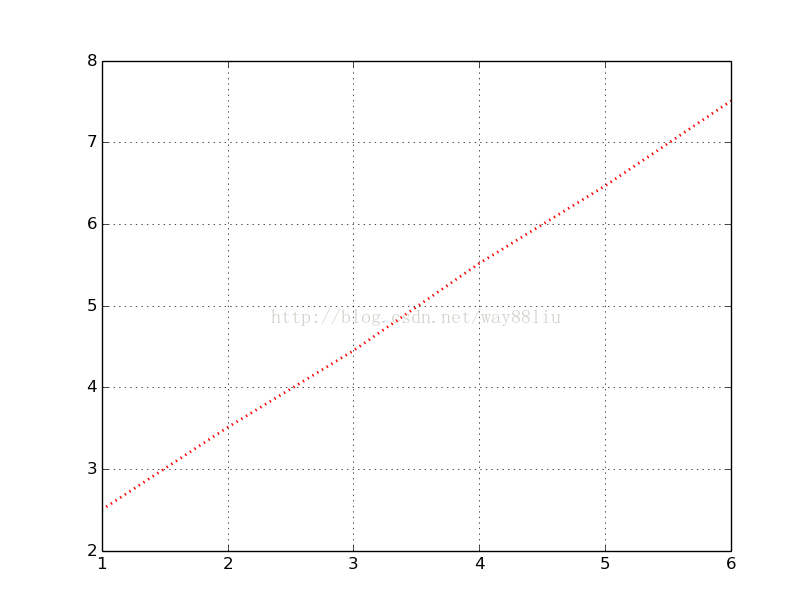
- x=[ 1 ,2 ,3 ,4 ,5 ,6]
- y=[ 2.5 ,3.51 ,4.45 ,5.52 ,6.47 ,7.51]
- a,b,r=linefit(x,y)
- print("X=",x)
- print("Y=",y)
- print("拟合结果: y = %10.5f x + %10.5f , r=%10.5f" % (a,b,r) )
- plt.plot(x, y, "r:", linewidth=2)
- plt.grid(True)
- plt.show()
2
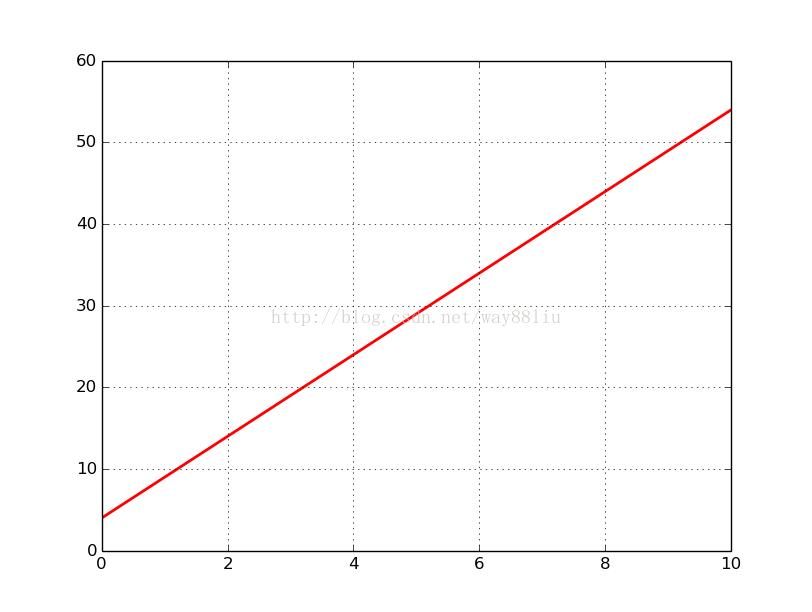
不用拟合,直接显示一个一元函数
- #-*- coding:utf-8 -*-
- import numpy as np
- import matplotlib.pyplot as plt
- import math
- f = lambda x:5*x+4
- tx = np.linspace(0,10,50)
- print tx
- plt.plot(tx, f(tx), "r-", linewidth=2)
- plt.grid(True)
- plt.show()