图片居中
方法1:
\centerline{\includegraphics[width=12cm]{KaribaDam}}
方法2:
\begin{figure}[htbp]
\centering
\includegraphics[width=12cm]{KaribaDam}
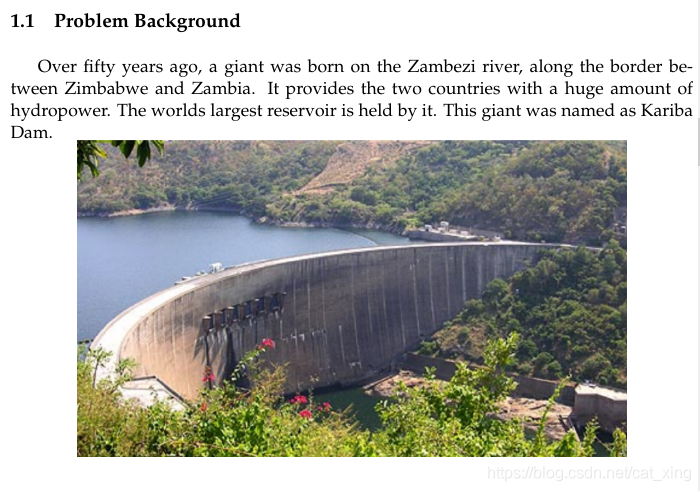
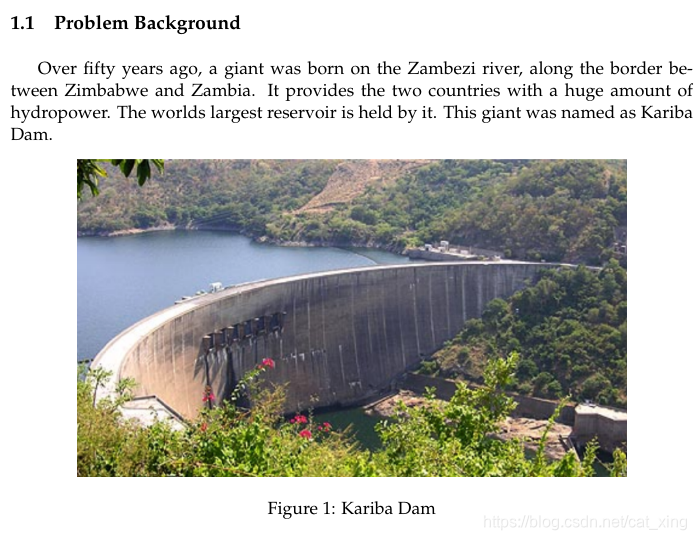
\caption{Kariba Dam}
\label{fig-KaribaDam}
\end{figure}
分点论述
\begin{enumerate}
	\item In the phase of modeling, we don’t consider extreme conditions on the river, like
	waterfalls, water cutoff seasons. Because these conditions require extremely big
	data. They are even unnecessary for in real life dams have dynamic strategies to
	handle them. We will discuss emergency water flow situations in another Section.
	\item Other existing dams are ignored. They are not as big as Kariba Dam. Few data
	about other dams on the river are accessible, especially thier effects on runoff of
	the river and slope of its hydraulic grade line. This assumption is flexible because
	it only affects the input data of the river, but not our model.
	\item We simplifies the water flow into an open-channel flow. Open-channel flow has a
	free surface. Based on this assumption, we are able to estimate the average velocity
	of the river’s water flow.
\end{enumerate}
参考资料:在Latex使用條列式清單itemize , enumerate , description [转]
段首顶格
\noindent