最近项目需要用到echarts图表,但网上关于结合angular使用不多,而且总是导入报错,关于我用的版本做一个总结:
(angular v6.0.9,echarts v4.1.0,@types/echarts v0.0.13)
1.安装 typings 库,以及 ECharts:
npm install typings echarts --global2.安装 ECharts 的 TypeScript 定义文件,这个文件来自社区贡献
npm install @types/echarts --save3.在 TypeScript 文件中导入echarts
(有可能在引入ECharts 时报出错误ECharts 找不到 Cannot find module echarts ,则需要npm install echarts --save)
import * as echarts from 'echarts'; ts代码:
import { Component, OnInit } from '@angular/core';
import * as echarts from 'echarts';
@Component({
  selector: 'app-dashboard',
  templateUrl: './dashboard.component.html',
  styleUrls: ['./dashboard.component.css']
})
export class DashboardComponent implements OnInit {

  constructor() {
    console.log(echarts)
  }

  ngOnInit() {
    this.initCharts();
  }

  initCharts(){
    const ec = echarts as any;
    let lineChart = ec.init(document.getElementById('lineChart'));
    let lineChartOption ={
            tooltip : {
                trigger: 'axis'
            },
            toolbox: {
                show : false,
            },
            legend:{
                padding:0
            },
            xAxis : [
                {
                    type : 'category',
                    boundaryGap : false,
                    data : ['1月','2月','3月','4月','5月','6月','7月','8月','9月','10月','11月','12月']
                }
            ],
            yAxis : [
                {
                    type : 'value'
                }
            ],
            series : [
                {
                    name:'新签合同额',
                    type:'line',
                    smooth:true,
                    itemStyle : {
                        normal : {
                            lineStyle:{
                                color:'#c8c8c8'
                            }
                        }
                    },
                    data:[10, 2, 5, 4, 6, 3, 7,2,2,3,6,7],

                },
                {
                    name:'营业收入',
                    type:'line',
                    smooth:true,
                    itemStyle: {
                        normal : {
                            lineStyle:{
                                color:'#1ab394'
                            }
                        }
                    },
                    data:[3, 2, 4, 7, 0, 3, 1,3,4,1,2,3]
                },
                {
                    name:'归属母公司净利润',
                    type:'line',
                    smooth:true,
                    itemStyle: {
                        normal : {
                            lineStyle:{
                                color:'#ff713a'
                            }
                        }
                    },
                    data:[10, 2, 6, 3, 2, 9, 10,3,4,8,4,3]
                }
            ]
        };
        lineChart.setOption(lineChartOption);
    }
}
html模板:
<div id="lineChart" style="width:400px;height:300px"></div>
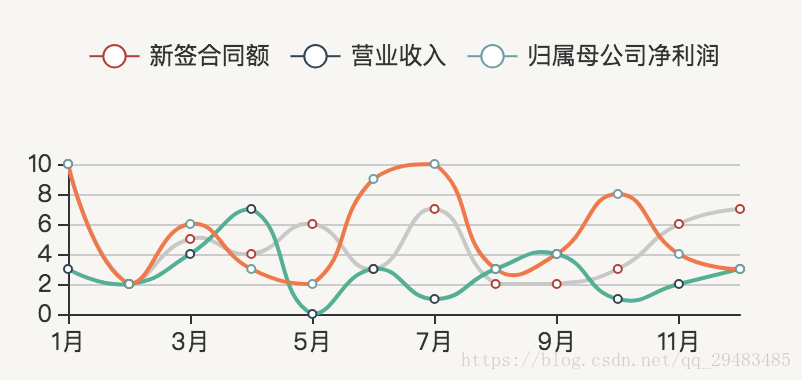
//一定要记得设置宽高下图为显示结果:
文章参考自:https://zhuanlan.zhihu.com/p/28902584