随着大数据时代的来临,更多的数据要求可视化操作,图表的应用需求也不断提高。那么在Vue中该怎样使用图表呢?
一、安装Echarts
npm install echarts -S二、在main.js引入,以便于全局使用
import echarts from 'echarts'
Vue.prototype.$echarts = echarts
三、绘制图表
<template>
<div>
<header>这是销量展示页面</header>
<div id="volume"></div>
<foottab></foottab>
</div>
</template>
<script>
//引入底部导航组件
import foottab from '../components/footTab.vue'
export default {
methods:{
drawBar(){
//基于准备好的dom,初始化echarts实例
let volume = this.$echarts.init(document.getElementById('volume'));
//绘制图表
volume.setOption({
title:{text:'商品销量'},
tooltip:{},
legend: {
data:['销量']
},
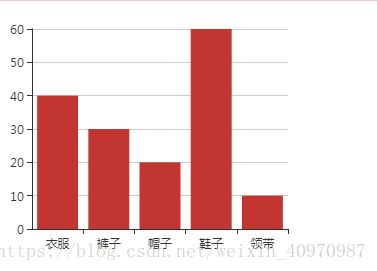
xAxis: {
data: ['衣服','裤子','帽子','鞋子','领带']
},
yAxis: {},
series: [{
name: '销量',
type: 'bar',
data: [40,30,20,60,10]
}]
})
}
},
mounted(){//模板或el对应的html渲染完成后再调用里面的方法
this.drawBar()
},
components: {
foottab
}
}
</script>
</script>
<style lang="scss" scoped>
#volume{
width:20em;
height:20em;
}
</style>这样即完成了绘制,绘制效果如下: