官方文档:https://www.echartsjs.com/option.html#xAxis.axisLine
趋势线:https://github.com/ecomfe/echarts-stat
<!-- 后台统计图表 -->
<template>
<div>
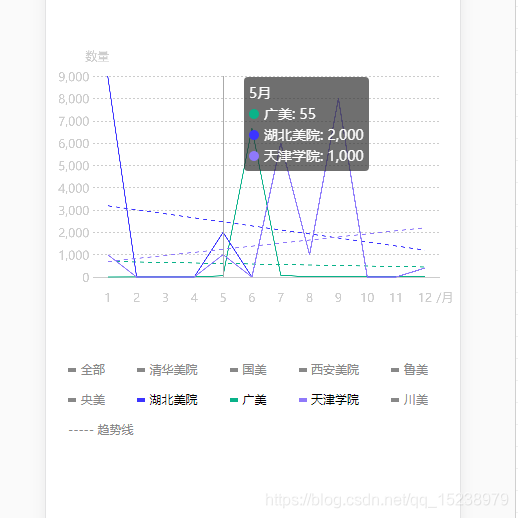
后台统计图表
<div class="echart">
<div id="main" :style="{
width: '100%', height: '2.6rem',margin:'0 auto'}"></div>
</div>
<div class="choose-wrap">
<div
class="item-choose nochecked"
v-for="(val,index) in chooseData"
:key="index"
@click="filtActiveData(val,$event)"
>
<div class="item-cicom" :style="{
background:val.color}"></div>
<div class="item-ctext">{
{val.name}}</div>
</div>
<div class="item-choose nochecked trendline">
<div class="item-ctext">----- 趋势线</div>
</div>
</div>
</div>
</template>
<script>
//这里可以导入其他文件(比如:组件,工具js,第三方插件js,json文件,图片文件等等)
//例如:import 《组件名称》 from '《组件路径》';
import echarts from "echarts";
import ecStat from "echarts-stat";
import {
setTimeout } from "timers";
export default {
//import引入的组件需要注入到对象中才能使用
components: {
},
data() {
//这里存放数据
return {
// 所有的数据
chooseData: [],
// 选中的数据
activeData: [],
// 图表配置数据
seriesData: [],
// 默认显示的月份
xshowData: [
"1",
"2",
"3",
"4",
"5",
"6",
"7",
"8",
"9",
"10",
"11",
"12"
],
// 默认隐藏的月份
xhideData: [
"1月",
"2月",
"3月",
"4月",
"5月",
"6月",
"7月",
"8月",
"9月",
"10月",
"11月",
"12月"
]
};
},
//监听属性 类似于data概念
computed: {
},
//监控data中的数据变化
watch: {
seriesData() {
this.echartDraw();
}
},
//方法集合
methods: {
// 过滤选中的数据
// typeObj, 操作的学院数据
// event, 如果存在的时候,说明不是显示全部
filtActiveData(typeObj, event) {
// es6 判断有没有数组是否存在一个值 如果有就删除,没有就添加
this.activeData.includes(typeObj)
? (this.activeData = this.activeData.filter(n => n !== typeObj))
: this.activeData.push(typeObj);
// 存在说明是用户主动点击的
// 不存在说明是初始化了全部数据
if (event) {
const eventObj = event.currentTarget;
if (this.activeData.includes(typeObj)) {
eventObj.classList.remove("nochecked");
} else {
eventObj.classList.add("nochecked");
}
// 如果点击的不是其它就去除全部的选中状态
// 否则点击的是全部就去除其它所有的数据
if (typeObj.name != "全部") {
this.activeData = this.activeData.filter(n => n.name !== "全部");
setTimeout(() => {
let cone = document.getElementsByClassName("item-choose")[0];
cone.classList.add("nochecked");
});
} else {
this.activeData = [];
this.activeData.push(this.chooseData[0]);
let itemList = document.getElementsByClassName("item-choose");
for (let itemObj of itemList) {
itemObj.classList.add("nochecked");
}
setTimeout(() => {
let cone = document.getElementsByClassName("item-choose")[0];
cone.classList.remove("nochecked");
});
}
} else {
// 初始化默认选中全部
setTimeout(() => {
let cone = document.getElementsByClassName("item-choose")[0];
cone.classList.remove("nochecked");
});
}
// 如果都没有选中其它院校就默认全部数据
if (this.activeData.length <= 0) {
this.activeData.push(this.chooseData[0]);
setTimeout(() => {
let cone = document.getElementsByClassName("item-choose")[0];
cone.classList.remove("nochecked");
});
}
let returnData = [];
for (let i = 0; i < this.activeData.length; i++) {
let forData = this.activeData[i];
this.myRegression = ecStat.regression("linear", forData.data);
this.myRegression.points.sort(function(a, b) {
return a[0] - b[0];
});
let forObj = {
obj: "", objEsat: "" };
// 数据
forObj.obj = {
// name: forData.name,
name: forData.name,
// type: "scatter",
type: "line",
// 取消折点圆圈
symbol: "none",
lineStyle: {
normal: {
color: forData.color,
width: 1
}
},
// 设置内容
tooltip: {
formatter: "数量"
},
itemStyle: {
color: forData.color
},
data: forData.data
};
// 趋势线
forObj.objEsat = {
name: "趋势线",
type: "line",
showSymbol: false,
smooth: false,
// 取消折点圆圈
symbol: "none",
lineStyle: {
normal: {
color: forData.color,
width: 1,
type: "dashed"
}
},
itemStyle: {
color: forData.color
},
// 隐藏趋势线
tooltip: {
show: false
},
data: this.myRegression.points
};
returnData.push(forObj);
}
this.seriesData = [];
for (let i = 0; i < returnData.length; i++) {
this.seriesData.push(returnData[i].obj);
if (returnData[i].objEsat) {
this.seriesData.push(returnData[i].objEsat);
}
}
console.log(this.seriesData,'图表真正需要的配置');
},
// 绘制图例
echartDraw() {
this.myChart.setOption(
{
grid: {
top: "14%",
bottom: "0%",
left: "2%", //相当于距离左边效果:padding-left
right: "5%", //相当于距离上边效果:padding-top
containLabel: true
},
// tooltip: {},
tooltip: {
trigger: "axis",
axisPointer: {
// type: 'cross',
axis: "x"
}
},
// 隐藏的x轴
xAxis: [
{
// name: "/月",
nameLocation: "end",
nameTextStyle: {
align: "right",
padding: [39, 0, 0, -24],
color: "#fff"
},
type: "category",
axisLine: {
lineStyle: {
color: "#fff"
}
},
// 一月到12月样式设置
axisLabel: {
// align:'right',
align: "center",
// margin: 14,
width: 5,
interval: 0,
color: "#fff"
// fontSize: 10,
// formatter: '{value}'
},
// 显示的标签数量
axisTick: false,
// offset:20,
splitLine: false,
// boundaryGap: false,
//
axisPointer: {
// type:'none', //无直线指示线
},
data: this.xhideData
},
// 显示出来的x轴
{
name: "/月",
nameLocation: "end",
position: "bottom",
nameTextStyle: {
align: "right",
padding: [39, 0, 0, -18]
},
type: "category",
axisLine: {
lineStyle: {
color: "#ccc"
}
},
// 一月到12月样式设置
axisLabel: {
// align:'right',
align: "center",
margin: 14,
width: 5,
interval: 0
// fontSize: 10,
// formatter: '{value}'
},
// 显示的标签数量
axisTick: false,
// offset:20,
splitLine: false,
// boundaryGap: false,
//
axisPointer: {
type: "none" //无直线指示线
},
data: this.xshowData
}
],
yAxis: {
name: "数量",
nameLocation: "end",
type: "value",
axisLine: {
lineStyle: {
width: "0",
color: "#ccc"
}
},
offset: "-4",
axisTick: false,
splitNumber: 9,
splitLine: {
lineStyle: {
type: "dotted"
}
}
},
series: this.seriesData
},
true
);
}
},
//生命周期 - 创建完成(可以访问当前this实例)
created() {
},
//生命周期 - 挂载完成(可以访问DOM元素)
mounted() {
var ajaxData = {
echartsData: [
[0, 9000],
[1, 0],
[2, 0],
[3, 0],
[4, 2000],
[5, 0],
[6, 6000],
[7, 1000],
[8, 8000],
[9, 0],
[10, 0],
[11, 400]
],
// 中央美术学院
ymData: [
[0, 1000],
[1, 0],
[2, 0],
[3, 0],
[4, 1000],
[5, 0],
[6, 6000],
[7, 1000],
[8, 8000],
[9, 0],
[10, 0],
[11, 400]
],
// 清华美院
qhmyData: [
[0, 9000],
[1, 0],
[2, 0],
[3, 0],
[4, 2000],
[5, 0],
[6, 6000],
[7, 1000],
[8, 8000],
[9, 0],
[10, 0],
[11, 400]
],
// 四川美术学院
scmyData: [
[0, 1000],
[1, 0],
[2, 0],
[3, 0],
[4, 1000],
[5, 0],
[6, 6000],
[7, 1000],
[8, 8000],
[9, 0],
[10, 0],
[11, 400]
],
// 西安美术学院
xamyData: [
[0, 9000],
[1, 0],
[2, 0],
[3, 0],
[4, 2000],
[5, 0],
[6, 6000],
[7, 1000],
[8, 8000],
[9, 0],
[10, 0],
[11, 400]
],
// 鲁迅美术学院
lxmyData: [
[0, 9000],
[1, 0],
[2, 0],
[3, 0],
[4, 2000],
[5, 0],
[6, 6000],
[7, 1000],
[8, 8000],
[9, 0],
[10, 0],
[11, 400]
],
// 中国美术学院
zgmyData: [
[0, 9000],
[1, 0],
[2, 0],
[3, 0],
[4, 2000],
[5, 0],
[6, 6000],
[7, 1000],
[8, 8000],
[9, 0],
[10, 0],
[11, 400]
],
// 湖北美术学院
hbmyData: [
[0, 9000],
[1, 0],
[2, 0],
[3, 0],
[4, 2000],
[5, 0],
[6, 6000],
[7, 1000],
[8, 8000],
[9, 0],
[10, 0],
[11, 400]
],
// 广州美术学院
gzmyData: [
[0, 1],
[1, 2],
[2, 3],
[3, 4],
[4, 55],
[5, 6666],
[6, 78],
[7, 8],
[8, 9],
[9, 10],
[10, 11],
[11, 12]
],
// 天津美术学院
tjmyData: [
[0, 1000],
[1, 0],
[2, 0],
[3, 0],
[4, 1000],
[5, 0],
[6, 6000],
[7, 1000],
[8, 8000],
[9, 0],
[10, 0],
[11, 400]
]
};
this.chooseData = [
{
slectname: "全部",
name: "全部",
color: "#333333",
type: "all",
data: ajaxData.echartsData
},
{
slectname: "清华美院",
name: "清华美院",
color: "#B858D0",
type: "qhmy",
data: ajaxData.qhmyData
},
{
slectname: "中国美术学院",
name: "国美",
color: "#51C4FF",
type: "zgmy",
data: ajaxData.zgmyData
},
{
slectname: "西安美术学院",
name: "西安美院",
color: "#41F070",
type: "xamy",
data: ajaxData.xamyData
},
{
slectname: "鲁迅美术学院",
name: "鲁美",
color: "#856B50",
type: "lxmy",
data: ajaxData.lxmyData
},
{
slectname: "中央美术学院",
name: "央美",
color: "#FF313E",
type: "ym",
data: ajaxData.ymData
},
{
slectname: "湖北美术学院",
name: "湖北美院",
color: "#3C34FF",
type: "xamy",
data: ajaxData.hbmyData
},
{
slectname: "广州美术学院",
name: "广美",
color: "#09B289",
type: "gzmy",
data: ajaxData.gzmyData
},
{
slectname: "天津美术学院",
name: "天津学院",
color: "#8F79FA",
type: "tjmy",
data: ajaxData.tjmyData
},
{
slectname: "四川美术学院",
name: "川美",
color: "#FB7E33",
type: "scmy",
data: ajaxData.scmyData
}
];
// 基于准备好的dom,初始化echarts实例
this.myChart = echarts.init(document.getElementById("main"));
this.filtActiveData(this.chooseData[0]);
},
beforeCreate() {
}, //生命周期 - 创建之前
beforeMount() {
}, //生命周期 - 挂载之前
beforeUpdate() {
}, //生命周期 - 更新之前
updated() {
}, //生命周期 - 更新之后
beforeDestroy() {
}, //生命周期 - 销毁之前
destroyed() {
}, //生命周期 - 销毁完成
activated() {
} //如果页面有keep-alive缓存功能,这个函数会触发
};
</script>
<style lang='less' scoped>
//@import url(); 引入公共css类
.echart {
margin: 100px 0 30px 0;
}
.choose-wrap {
padding-right: 10px;
&::after {
content: "";
display: table;
clear: both;
}
.item-choose {
width: 20%;
height: 30px;
line-height: 30px;
float: left;
text-align: center;
.item-cicom {
width: 8px;
height: 4px;
background: rgba(255, 49, 62, 1);
display: inline-block;
vertical-align: middle;
}
.item-ctext {
color: #000;
display: inline-block;
font-size: 12px;
}
}
.nochecked {
.item-cicom {
background: #888888 !important;
}
.item-ctext {
color: #888888;
}
}
.trendline {
padding-left: 22px;
width: 100%;
text-align: left;
color: #b3b3b3;
}
}
</style>