在微信小程序中使用ECharts
1. 下载插件
首先,下载 GitHub 上的 ecomfe/echarts-for-weixin 项目。
下载链接:ecomfe/echarts-for-weixin
2. 运行项目可查看图表示例

3. 使用组件
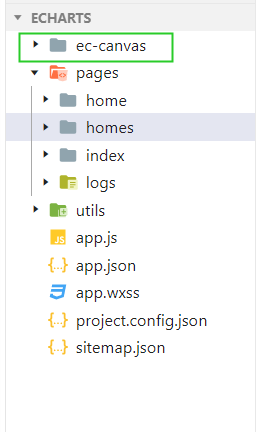
//ec-canvas是提供的组件,将文件夹ec-canvas复制到自己的项目中
//配置要应用组件的json文件,我这里是home.json,一定注意路径要写对。
{
  "usingComponents": {
    "ec-canvas": "../../ec-canvas/ec-canvas"
  }
}
// 在home.js引用echarts
import * as echarts from '../../ec-canvas/echarts';
//配置全局css
/**app.wxss**/
.container {
  position: absolute;
  top: 0;
  bottom: 0;
  left: 0;
  right: 0;
  display: flex;  /* flex布局 */
  /* 注意:设为Flex布局以后,子元素的float、clear和vertical-align属性将失效。 */
  flex-direction: column;  /*决定主轴的方向(即项目的排列方向) */
  /* column:主轴为垂直方向,起点在上沿。*/
  align-items: center;   /*定义项目在交叉轴上如何对齐 */
  /* center:交叉轴的中点对齐*/
  justify-content: space-between;   /* 定义了项目在主轴上的对齐方式 */
  /* space-between:两端对齐,项目之间的间隔都相等 */
  box-sizing: border-box;
  /*
    content-box:padding和border不被包含在定义的width和height之内
    盒子的实际宽度=设置的width+padding+border
    border-box:padding和border被包含在定义的width和height之内。
    盒子的实际宽度=设置的width(padding和border不会影响实际宽度)
  */
}
//home.wxml
<view class="container">
  <ec-canvas id="mychart-dom-bar" canvas-id="mychart-bar" ec="{{ ec }}"></ec-canvas>
</view>
其中 ec 是一个我们在 index.js 中定义的对象,它使得图表能够在页面加载后被初始化并设置。
//home.wxss
ec-canvas {
  width: 100%;
  height: 50%;
  background: #eee;
}
//home.js
Page({
  data: {
    ec: {
      onInit: initChart
    }
  }
});
function initChart(canvas, width, height) {
  const chart = echarts.init(canvas, null, {
    width: width,
    height: height
  });
  canvas.setChart(chart);

  var option = {
    ...
  };
  chart.setOption(option);
  return chart;
}
这对于所有 ECharts 图表都是通用的,用户只需要修改上面 option 的内容,即可改变图表。option 的使用方法参见 ECharts 配置项文档。对于不熟悉 ECharts 的用户,可以参见5 分钟上手 ECharts 教程 。