版权声明:本文为博主原创文章,未经博主允许不得转载。 https://blog.csdn.net/luyaran/article/details/82772338
二项分布模型用来处理在一系列实验中只发现两个可能结果的事件的成功概率,例如,掷硬币总是两种结果:正面或反面。我们可以使用二项式分布估算在重复抛掷硬币10次时正好准确地找到3次是正面的概率。在R中具有四个内置函数来生成二项分布,如下:
dbinom(x, size, prob)
pbinom(x, size, prob)
qbinom(p, size, prob)
rbinom(n, size, prob)
参数描述如下:
- x - 是数字的向量。
- p - 是概率向量。
- n - 是观察次数。
- size - 是试验的次数。
- prob - 是每次试验成功的概率。
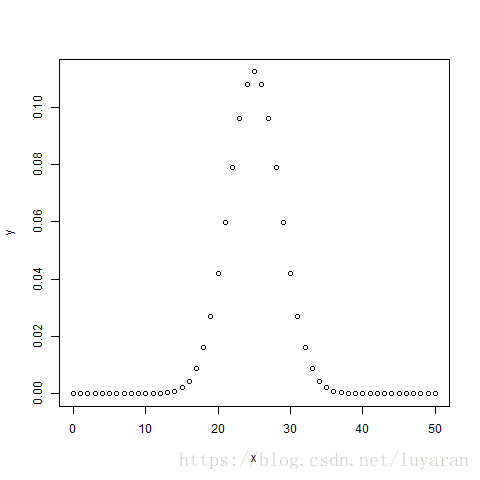
dbinom函数给出了每个点的概率密度分布,案例如下:
setwd("D:/r_file")
# Create a sample of 50 numbers which are incremented by 1.
x <- seq(0,50,by = 1)

# Create the binomial distribution.
y <- dbinom(x,50,0.5)

# Give the chart file a name.
png(file = "dbinom.png")

# Plot the graph for this sample.
plot(x,y)

# Save the file.
dev.off()
输出如下:
pbinom函数给出事件的累积概率,它用于表示概率的单个值,案例如下:
setwd("D:/r_file")
# Probability of getting 26 or less heads from a 51 tosses of a coin.
x <- pbinom(26,51,0.5)

print(x)
结果如下:
[1] 0.610116qbinom函数采用概率值,并给出其累积值与概率值匹配的数字,案例如下:
setwd("D:/r_file")
# How many heads will have a probability of 0.25 will come out when a coin is tossed 51 times.
x <- qbinom(0.25,51,1/2)

print(x)
输出结果为:
[1] 23rbinom函数从给定样本生成所需数量的给定概率的随机值,案例如下:
# Find 8 random values from a sample of 150 with probability of 0.4.
x <- rbinom(8,150,.4)

print(x)
输出结果为:
扫描二维码关注公众号,回复:
3270335 查看本文章

[1] 58 61 59 66 55 60 61 67好啦,本次记录就到这里了。
如果感觉不错的话,请多多点赞支持哦。。。