版权声明:本文为博主原创文章,未经博主允许不得转载。 https://blog.csdn.net/Cocaine_bai/article/details/80749588
数据分析–用R语言预测离职(上)
本文参考的文章:
1.R语言-离职率分析
2.R语言-逻辑回归+主成分分析-员工离职预测训练赛
3.Kaggle十大经典案例—员工离职预测
4.Kaggle十大案例精讲(免费)
5.数据分析实例:员工流失建模与预测
数据来源:
SAMPLE DATA: HR Employee Attrition and Performance
数据可以直接下载,字段都是英文的,部分字段描述如下:
| 变量类型 | 变量名 | 描述 | 取值范围 |
|---|---|---|---|
| 结果变量 | Attrition | 员工是否流失 | Yes, No |
| 自变量 | Age | 年龄 | 数值 |
| BusinessTravel | 出差 | 1.Non-Travel, 2.Travel_Rarely 3.Travel_Frequently | |
| Department | 部门 | 1.Sales 2.Research & Development 3.Human Resources | |
| DistanceFromHome | 公司到家的距离 | 数值 | |
| Education | 学历 | 1 ‘Below College’ 2 ‘College’ 3 ‘Bachelor’ 4 ‘Master’ 5 ‘Doctor’ | |
| EducationField | 学历领域 | ||
| EnvironmentSatisfaction | 环境满意度 | 1 ‘Low’ 2 ‘Medium’ 3 ‘High’ 4 ‘Very High’ | |
| Gender | 性别 | 1.Male 2.Female | |
| JobInvolvement | 工作投入 | 1 ‘Low’ 2 ‘Medium’ 3 ‘High’ 4 ‘Very High’ | |
| JobLevel | 职位等级 | ||
| JobRole | 职位 | ||
| JobSatisfaction | 工作满意度 | 1 ‘Low’ 2 ‘Medium’ 3 ‘High’ 4 ‘Very High’ | |
| MaritalStatus | 是否结婚 | 1.Single 2.Married 3.Divorced | |
| MonthlyIncome | 月收入 | 数值 | |
| NumCompaniesWorked | 任职过的企业数量 | 数值 | |
| OverTime | 是否加班 | Yes, No | |
| PercentSalaryHike | 涨薪百分比 | 数值 | |
| PerformanceRating | 绩效评分 | 1 ‘Low’ 2 ‘Medium’ 3 ‘High’ 4 ‘Very High’ | |
| RelationshipSatisfaction | 关系满意度 | 1 ‘Low’ 2 ‘Medium’ 3 ‘High’ 4 ‘Very High’ | |
| StockOptionLevel | 员工优先认股权 | 数值 | |
| TotalWorkingYears | 工龄 | 数值 | |
| TrainingTimesLastYear | 上一年培训次数 | 数值 | |
| WorkLifeBalance | 工作与生活平衡情况 | 1 ‘Bad’ 2 ‘Good’ 3 ‘Better’ 4 ‘Best’ | |
| YearsAtCompany | 在公司工作时间 | 数值 | |
| YearsInCurrentRole | 当前职位的工作时间 | 数值 | |
| YearsSinceLastPromotion | 距离上次升职的时间 | 数值 | |
| YearsWithCurrManager | 与当前经理工作的时间 | 数值 |
数据读取
读取数据之后,summary一下,观察变量
(注意一点:在读取数据的时候,stringsAsFactors = T,因为数据里面有字符串的变量)
> attr.df <- read.csv("HR-Employee-Attrition.csv",header = T,stringsAsFactors = T)
> summary(attr.df)
      Age        Attrition            BusinessTravel   DailyRate                       Department  DistanceFromHome
 Min.   :18.00   No :1233   Non-Travel       : 150   Min.   : 102.0   Human Resources       : 63   Min.   : 1.000
 1st Qu.:30.00   Yes: 237   Travel_Frequently: 277   1st Qu.: 465.0   Research & Development:961   1st Qu.: 2.000
 Median :36.00              Travel_Rarely    :1043   Median : 802.0   Sales                 :446   Median : 7.000
 Mean   :36.92                                       Mean   : 802.5                                Mean   : 9.193
 3rd Qu.:43.00                                       3rd Qu.:1157.0                                3rd Qu.:14.000
 Max.   :60.00                                       Max.   :1499.0                                Max.   :29.000

   Education              EducationField EmployeeCount EmployeeNumber   EnvironmentSatisfaction    Gender
 Min.   :1.000   Human Resources : 27    Min.   :1     Min.   :   1.0   Min.   :1.000           Female:588
 1st Qu.:2.000   Life Sciences   :606    1st Qu.:1     1st Qu.: 491.2   1st Qu.:2.000           Male  :882
 Median :3.000   Marketing       :159    Median :1     Median :1020.5   Median :3.000
 Mean   :2.913   Medical         :464    Mean   :1     Mean   :1024.9   Mean   :2.722
 3rd Qu.:4.000   Other           : 82    3rd Qu.:1     3rd Qu.:1555.8   3rd Qu.:4.000
 Max.   :5.000   Technical Degree:132    Max.   :1     Max.   :2068.0   Max.   :4.000

   HourlyRate     JobInvolvement    JobLevel                          JobRole    JobSatisfaction  MaritalStatus
 Min.   : 30.00   Min.   :1.00   Min.   :1.000   Sales Executive          :326   Min.   :1.000   Divorced:327
 1st Qu.: 48.00   1st Qu.:2.00   1st Qu.:1.000   Research Scientist       :292   1st Qu.:2.000   Married :673
 Median : 66.00   Median :3.00   Median :2.000   Laboratory Technician    :259   Median :3.000   Single  :470
 Mean   : 65.89   Mean   :2.73   Mean   :2.064   Manufacturing Director   :145   Mean   :2.729
 3rd Qu.: 83.75   3rd Qu.:3.00   3rd Qu.:3.000   Healthcare Representative:131   3rd Qu.:4.000
 Max.   :100.00   Max.   :4.00   Max.   :5.000   Manager                  :102   Max.   :4.000
                                                 (Other)                  :215
 MonthlyIncome    MonthlyRate    NumCompaniesWorked Over18   OverTime   PercentSalaryHike PerformanceRating
 Min.   : 1009   Min.   : 2094   Min.   :0.000      Y:1470   No :1054   Min.   :11.00     Min.   :3.000
 1st Qu.: 2911   1st Qu.: 8047   1st Qu.:1.000               Yes: 416   1st Qu.:12.00     1st Qu.:3.000
 Median : 4919   Median :14236   Median :2.000                          Median :14.00     Median :3.000
 Mean   : 6503   Mean   :14313   Mean   :2.693                          Mean   :15.21     Mean   :3.154
 3rd Qu.: 8379   3rd Qu.:20462   3rd Qu.:4.000                          3rd Qu.:18.00     3rd Qu.:3.000
 Max.   :19999   Max.   :26999   Max.   :9.000                          Max.   :25.00     Max.   :4.000

 RelationshipSatisfaction StandardHours StockOptionLevel TotalWorkingYears TrainingTimesLastYear WorkLifeBalance
 Min.   :1.000            Min.   :80    Min.   :0.0000   Min.   : 0.00     Min.   :0.000         Min.   :1.000
 1st Qu.:2.000            1st Qu.:80    1st Qu.:0.0000   1st Qu.: 6.00     1st Qu.:2.000         1st Qu.:2.000
 Median :3.000            Median :80    Median :1.0000   Median :10.00     Median :3.000         Median :3.000
 Mean   :2.712            Mean   :80    Mean   :0.7939   Mean   :11.28     Mean   :2.799         Mean   :2.761
 3rd Qu.:4.000            3rd Qu.:80    3rd Qu.:1.0000   3rd Qu.:15.00     3rd Qu.:3.000         3rd Qu.:3.000
 Max.   :4.000            Max.   :80    Max.   :3.0000   Max.   :40.00     Max.   :6.000         Max.   :4.000

 YearsAtCompany   YearsInCurrentRole YearsSinceLastPromotion YearsWithCurrManager
 Min.   : 0.000   Min.   : 0.000     Min.   : 0.000          Min.   : 0.000
 1st Qu.: 3.000   1st Qu.: 2.000     1st Qu.: 0.000          1st Qu.: 2.000
 Median : 5.000   Median : 3.000     Median : 1.000          Median : 3.000
 Mean   : 7.008   Mean   : 4.229     Mean   : 2.188          Mean   : 4.123
 3rd Qu.: 9.000   3rd Qu.: 7.000     3rd Qu.: 3.000          3rd Qu.: 7.000
 Max.   :40.000   Max.   :18.000     Max.   :15.000          Max.   :17.000
我们的数据总共有1470行,35列
上面Attrition是我们研究的变量:代表是否离职的意思
从上面我们可以看出:
1.离职的人数占总人数的 16%左右;
2.月收入平均为:6503,中值为:4919,其中中值更能代表薪资水平
3.加班的人数占总人数的28%(Overtime字段)
数据分析及可视化
下面我们来看下离职的人和各个变量之间的关系:
> library(ggplot2)
> library(gridExtra)
> g1 <- ggplot(attr.df, aes(x=Age,fill=Attrition))+
+   geom_density(alpha = 0.7)
> g2 <- ggplot(attr.df, aes(x=DistanceFromHome, fill=Attrition))+
+   geom_density(alpha = 0.7)
> g3 <- ggplot(attr.df, aes(x=MonthlyIncome, fill=Attrition))+
+   geom_density(alpha = 0.7)
> g4 <- ggplot(attr.df, aes(x=NumCompaniesWorked, fill= Attrition))+
+   geom_density(alpha = 0.7)
> g5 <- ggplot(attr.df, aes(x=TotalWorkingYears, fill= Attrition))+
+   geom_density(alpha = 0.7)
> g6 <- ggplot(attr.df, aes(x=TrainingTimesLastYear, fill= Attrition))+
+   geom_density(alpha = 0.7)
> g7 <- ggplot(attr.df, aes(x=YearsAtCompany, fill= Attrition))+
+   geom_density(alpha = 0.7)
> g8 <- ggplot(attr.df, aes(x=YearsInCurrentRole, fill= Attrition))+
+   geom_density(alpha = 0.7)
> g9 <- ggplot(attr.df, aes(x=YearsWithCurrManager, fill= Attrition))+
+   geom_density(alpha = 0.7)
> grid.arrange(g1,g2,g3,g4,g5,g6,g7,g8,g9, ncol = 3, nrow = 3)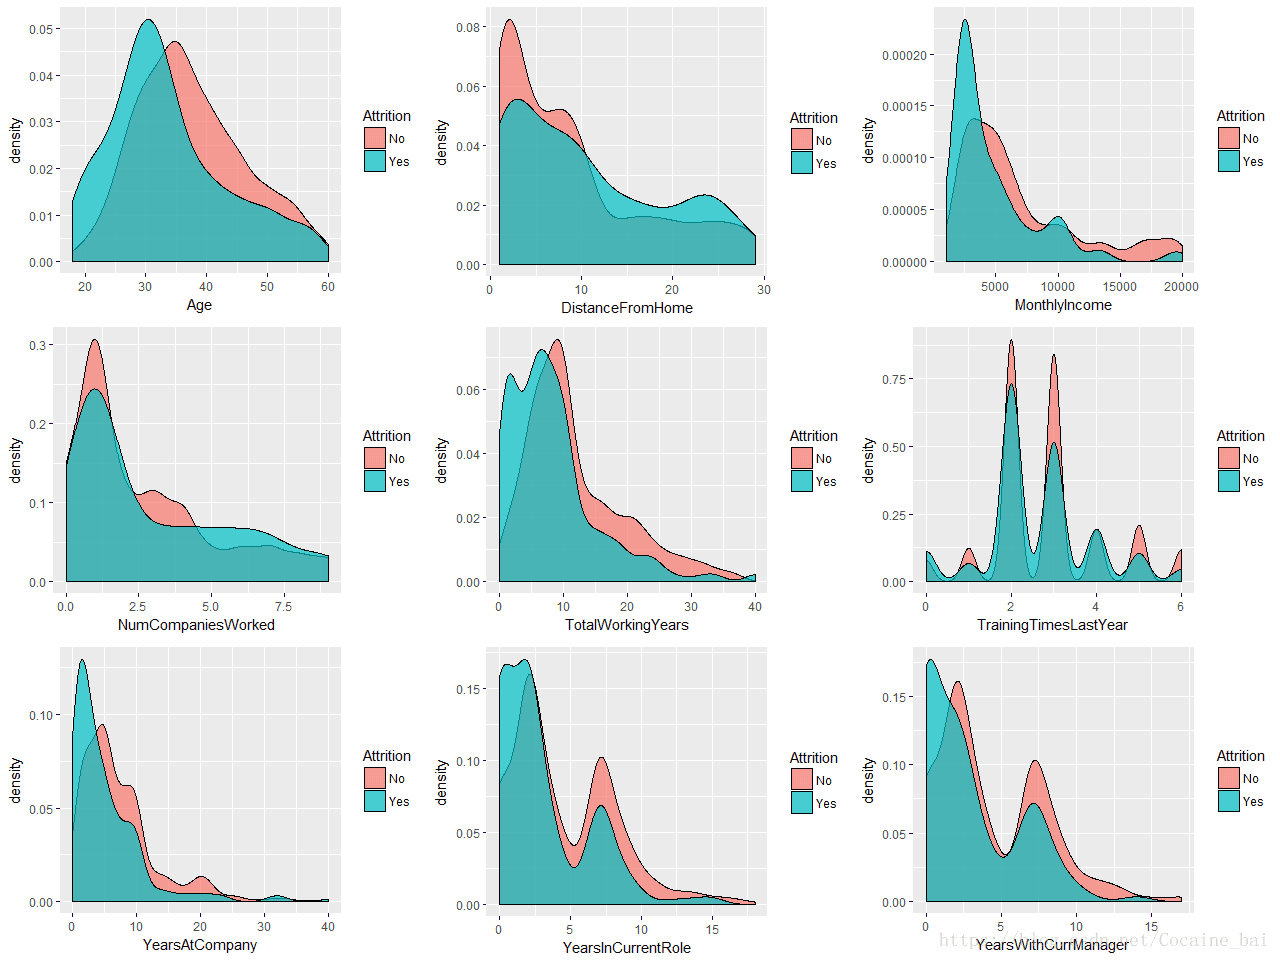
这里选择的9个变量,来做核密度曲线:
其中我们可以看出
1.从年龄上面看30岁左右的人员是离职的高峰,
2.从离家距离来看,10英里意外的人员离职的概率会比较大
3.低收入的人员离职概率较大
4.在任职公司超过5个的离职概率较大
5.工龄在5年以下的离职率要高
其可能的原因在于年轻的员工更倾向于多尝试,且对未来目标相对迷茫,高流失率也意味着此类员工难以在短期形成对企业价值观的长期认同。