目录
信息增益(Information gain) - ID3算法
算法简介
决策数(Decision Tree)在机器学习中也是比较常见的一种算法,属于监督学习中的一种。其中ID3算法是以信息熵和信息增益作为衡量标准的分类算法。
信息熵(Entropy)
熵的概念主要是指信息的混乱程度,变量的不确定性越大,熵的值也就越大,熵的公式可以表示为:
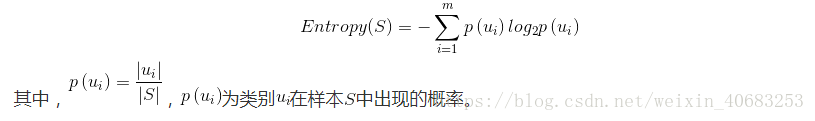
信息增益(Information gain) - ID3算法
信息增益指的是根据特征划分数据前后熵的变化,可以用下面的公式表示:

根据不同特征分类后熵的变化不同,信息增益也不同,信息增益越大,区分样本的能力越强,越具有代表性。 这是一种自顶向下的贪心策略,即在ID3中根据“最大信息增益”原则选择特征。
ID3采用信息增益来选择特征,存在一个缺点,它一般会优先选择有较多属性值的特征,因为属性值多的特征会有相对较大的信息增益。(这是因为:信息增益反映的给定一个条件以后不确定性减少的程度,必然是分得越细的数据集确定性更高,也就是条件熵越小,信息增益越大)。
信息增益率(gain ratio) - C4.5算法
为了避免ID3的不足,C4.5中是用信息增益率(gain ratio)来作为选择分支的准则。对于有较多属性值的特征,信息增益率的分母Split information(S,A),我们称之为分裂信息,会稀释掉它对特征选择的影响。分裂信息(公式1)和信息增益率(公式2)的计算如下所示。

源数据
| 收入 | 身高 | 长相 | 体型 | 是否见面 |
| 一般 | 高 | 丑 | 胖 | 否 |
| 高 | 一般 | 帅 | 瘦 | 是 |
| 一般 | 一般 | 一般 | 一般 | 否 |
| 高 | 高 | 丑 | 一般 | 是 |
| 一般 | 高 | 帅 | 胖 | 是 |
这是一位单身女性根据对方的一些基本条件,判断是否去约会的数据,此处展示前五行。我们要通过这位女士历史的数据建立决策树模型,使得尽量给这位女性推送她比较愿意约会的异性信息。
代码实现 - ID3算法
from math import log
import operator
import numpy as np
import pandas as pd
from pandas import DataFrame,Series

# 计算数据的熵(entropy)-原始熵
def dataentropy(data, feat):
    lendata=len(data)  # 数据条数
    labelCounts={} # 数据中不同类别的条数
    for featVec in data:
        category=featVec[-1] # 每行数据的最后一个字(叶子节点)
        if category not in labelCounts.keys():
            labelCounts[category]=0
        labelCounts[category]+=1  # 统计有多少个类以及每个类的数量
    entropy=0
    for key in labelCounts:
        prob=float(labelCounts[key])/lendata # 计算单个类的熵值
        entropy-=prob*log(prob,2) # 累加每个类的熵值
    return entropy


# 处理后导入数据数据
def Importdata(datafile):
    dataa = pd.read_excel(datafile)#datafile是excel文件,所以用read_excel,如果是csv文件则用read_csv
    #将文本中不可直接使用的文本变量替换成数字
    productDict={'高':1,'一般':2,'低':3, '帅':1,  '丑':3,  '胖':3,  '瘦':1,  '是':1,  '否':0}
    dataa['income'] = dataa['收入'].map(productDict)#将每一列中的数据按照字典规定的转化成数字
    dataa['hight'] = dataa['身高'].map(productDict)
    dataa['look'] = dataa['长相'].map(productDict)
    dataa['shape'] = dataa['体型'].map(productDict)
    dataa['is_meet'] = dataa['是否见面'].map(productDict)

    data = dataa.iloc[:,5:].values.tolist()#取量化后的几列,去掉文本列
    b = dataa.iloc[0:0,5:-1]
    labels = b.columns.values.tolist()#将标题中的值存入列表中
    return data,labels

# 按某个特征value分类后的数据
def splitData(data,i,value):
    splitData=[]
    for featVec in data:
        if featVec[i]==value:
            rfv =featVec[:i]
            rfv.extend(featVec[i+1:])
            splitData.append(rfv)
    return splitData


# 选择最优的分类特征
def BestSplit(data):
    numFea = len(data[0])-1#计算一共有多少个特征,因为最后一列一般是分类结果,所以需要-1
    baseEnt = dataentropy(data,-1)   # 定义初始的熵,用于对比分类后信息增益的变化
    bestInfo = 0
    bestFeat = -1
    for i in range(numFea):
        featList = [rowdata[i] for rowdata in data]
        uniqueVals = set(featList)
        newEnt = 0
        for value in uniqueVals:
            subData = splitData(data,i,value)#获取按照特征value分类后的数据
            prob =len(subData)/float(len(data))
            newEnt +=prob*dataentropy(subData,i)  # 按特征分类后计算得到的熵
        info = baseEnt - newEnt  # 原始熵与按特征分类后的熵的差值,即信息增益
        if (info>bestInfo):   # 若按某特征划分后,若infoGain大于bestInf,则infoGain对应的特征分类区分样本的能力更强,更具有代表性。
            bestInfo=info #将infoGain赋值给bestInf,如果出现比infoGain更大的信息增益,说明还有更好地特征分类
            bestFeat = i #将最大的信息增益对应的特征下标赋给bestFea,返回最佳分类特征
    return bestFeat

#按分类后类别数量排序,取数量较大的
def majorityCnt(classList):
    c_count={}
    for i in classList:
        if i not in c_count.keys():
            c_count[i]=0
        c_count[i]+=1
    ClassCount = sorted(c_count.items(),key=operator.itemgetter(1),reverse=True)#按照统计量降序排序
    return ClassCount[0][0]#reverse=True表示降序,因此取[0][0],即最大值

#建树
def createTree(data,labels):
    classList = [rowdata[-1] for rowdata in data]  # 取每一行的最后一列,分类结果(1/0)
    if classList.count(classList[0])==len(classList):
        return classList[0]
    if len(data[0])==1:
        return majorityCnt(classList)
    bestFeat = BestSplit(data) #根据信息增益选择最优特征
    bestLab = labels[bestFeat]
    myTree = {bestLab:{}} #分类结果以字典形式保存
    del(labels[bestFeat])
    featValues = [rowdata[bestFeat] for rowdata in data]
    uniqueVals = set(featValues)
    for value in uniqueVals:
        subLabels = labels[:]
        myTree[bestLab][value] = createTree(splitData(data,bestFeat,value),subLabels)
    return myTree


if __name__=='__main__':
    datafile = u'E:\\pythondata\\tree.xlsx'#文件所在位置,u为防止路径中有中文名称
    data, labels=Importdata(datafile)  # 导入数据
    print(createTree(data, labels))  # 输出决策树模型结果
运行结果:
{'hight': {1: {'look': {1: {'income': {1: {'shape': {1: 1, 2: 1}}, 2: 1, 3: {'shape': {1: 1, 2: 0}}}}, 2: 1, 3: {'income': {1: 1, 2: 0}}}}, 2: {'income': {1: 1, 2: {'look': {1: 1, 2: 0}}, 3: 0}}, 3: {'look': {1: {'shape': {3: 0, 1: 1}}, 2: 0, 3: 0}}}}
对应的决策树:

代码实现 - C4.5算法
C4.5算法和ID3算法逻辑很相似,只是ID3算法是用信息增益来选择特征,而C4.5算法是用的信息增益率,因此对代码的影响也只有BestSplit(data)函数的定义部分,只需要加一个信息增益率的计算即可,BestSplit(data)函数定义代码更改后如下:
# 选择最优的分类特征
def BestSplit(data):
    numFea = len(data[0])-1#计算一共有多少个特征,因为最后一列一般是分类结果,所以需要-1
    baseEnt = dataentropy(data,-1)   # 定义初始的熵,用于对比分类后信息增益的变化
    bestGainRate = 0
    bestFeat = -1
    for i in range(numFea):
        featList = [rowdata[i] for rowdata in data]
        uniqueVals = set(featList)
        newEnt = 0
        for value in uniqueVals:
            subData = splitData(data,i,value)#获取按照特征value分类后的数据
            prob =len(subData)/float(len(data))
            newEnt +=prob*dataentropy(subData,i)  # 按特征分类后计算得到的熵
        info = baseEnt - newEnt  # 原始熵与按特征分类后的熵的差值,即信息增益
        splitonfo = dataentropy(subData,i) #分裂信息
        if splitonfo == 0:#若特征值相同(eg:长相这一特征的值都是帅),即splitonfo和info均为0,则跳过该特征
            continue
        GainRate = info/splitonfo #计算信息增益率
        if (GainRate>bestGainRate):   # 若按某特征划分后,若infoGain大于bestInf,则infoGain对应的特征分类区分样本的能力更强,更具有代表性。
            bestGainRate=GainRate #将infoGain赋值给bestInf,如果出现比infoGain更大的信息增益,说明还有更好地特征分类
            bestFeat = i #将最大的信息增益对应的特征下标赋给bestFea,返回最佳分类特征
    return bestFeat
运行结果:
{'hight': {1: {'look': {1: {'income': {1: {'shape': {0: 0, 1: 1}}, 2: 1, 3: {'shape': {0: 0, 1: 1}}}}, 2: 1, 3: {'shape': {0: 0, 1: 1}}}}, 2: {'shape': {0: 0, 1: 1}}, 3: {'shape': {1: 0, 3: {'look': {0: 0, 1: 1}}}}}}
画决策树代码-treePlotter
决策树可以代码实现的,不需要按照运行结果一点一点手动画图。
import treePlotter
treePlotter.createPlot(myTree)
其中treePlotter模块是如下一段代码,可以保存为.py文件,放在Python/Lib/site-package目录下,然后用的时候import 【文件名】就可以了。
treePlotter模块代码:
#绘制决策树
import matplotlib.pyplot as plt

# 定义文本框和箭头格式,boxstyle用于指定边框类型,color表示填充色
decisionNode = dict(boxstyle="round4", color='#ccccff')  #定义判断结点为圆角长方形,填充浅蓝色
leafNode = dict(boxstyle="circle", color='#66ff99')  #定义叶结点为圆形,填充绿色
arrow_args = dict(arrowstyle="<-", color='ffcc00')  #定义箭头及颜色


#绘制带箭头的注释
def plotNode(nodeTxt, centerPt, parentPt, nodeType):
    createPlot.ax1.annotate(nodeTxt, xy=parentPt, xycoords='axes fraction',
                            xytext=centerPt, textcoords='axes fraction',
                            va="center", ha="center", bbox=nodeType, arrowprops=arrow_args)


#计算叶结点数
def getNumLeafs(myTree):
    numLeafs = 0
    firstStr = myTree.keys()[0]
    secondDict = myTree[firstStr]
    for key in secondDict.keys():
        if type(secondDict[key]).__name__ == 'dict':
            numLeafs += getNumLeafs(secondDict[key])
        else:
            numLeafs += 1
    return numLeafs


#计算树的层数
def getTreeDepth(myTree):
    maxDepth = 0
    firstStr = myTree.keys()[0]
    secondDict = myTree[firstStr]
    for key in secondDict.keys():
        if type(secondDict[key]).__name__ == 'dict':
            thisDepth = 1 + getTreeDepth(secondDict[key])
        else:
            thisDepth = 1
        if thisDepth > maxDepth:
            maxDepth = thisDepth
    return maxDepth


#在父子结点间填充文本信息
def plotMidText(cntrPt, parentPt, txtString):
    xMid = (parentPt[0] - cntrPt[0]) / 2.0 + cntrPt[0]
    yMid = (parentPt[1] - cntrPt[1]) / 2.0 + cntrPt[1]
    createPlot.ax1.text(xMid, yMid, txtString, va="center", ha="center", rotation=30)


def plotTree(myTree, parentPt, nodeTxt):
    numLeafs = getNumLeafs(myTree)
    depth = getTreeDepth(myTree)
    firstStr = myTree.keys()[0]
    cntrPt = (plotTree.xOff + (1.0 + float(numLeafs)) / 2.0 / plotTree.totalW, plotTree.yOff)
    plotMidText(cntrPt, parentPt, nodeTxt)  #在父子结点间填充文本信息
    plotNode(firstStr, cntrPt, parentPt, decisionNode)  #绘制带箭头的注释
    secondDict = myTree[firstStr]
    plotTree.yOff = plotTree.yOff - 1.0 / plotTree.totalD
    for key in secondDict.keys():
        if type(secondDict[key]).__name__ == 'dict':
            plotTree(secondDict[key], cntrPt, str(key))
        else:
            plotTree.xOff = plotTree.xOff + 1.0 / plotTree.totalW
            plotNode(secondDict[key], (plotTree.xOff, plotTree.yOff), cntrPt, leafNode)
            plotMidText((plotTree.xOff, plotTree.yOff), cntrPt, str(key))
    plotTree.yOff = plotTree.yOff + 1.0 / plotTree.totalD


def createPlot(inTree):
    fig = plt.figure(1, facecolor='white')
    fig.clf()
    axprops = dict(xticks=[], yticks=[])
    createPlot.ax1 = plt.subplot(111, frameon=False, **axprops)
    plotTree.totalW = float(getNumLeafs(inTree))
    plotTree.totalD = float(getTreeDepth(inTree))
    plotTree.xOff = -0.5 / plotTree.totalW;
    plotTree.yOff = 1.0;
    plotTree(inTree, (0.5, 1.0), '')
    plt.show()