前言
本文使用的数据集包含43种交通标志,使用opencv以及卷积神经网络训练模型,识别交通标志,使用pyqt5制作交通标志识别GUI的界面。
效果预览
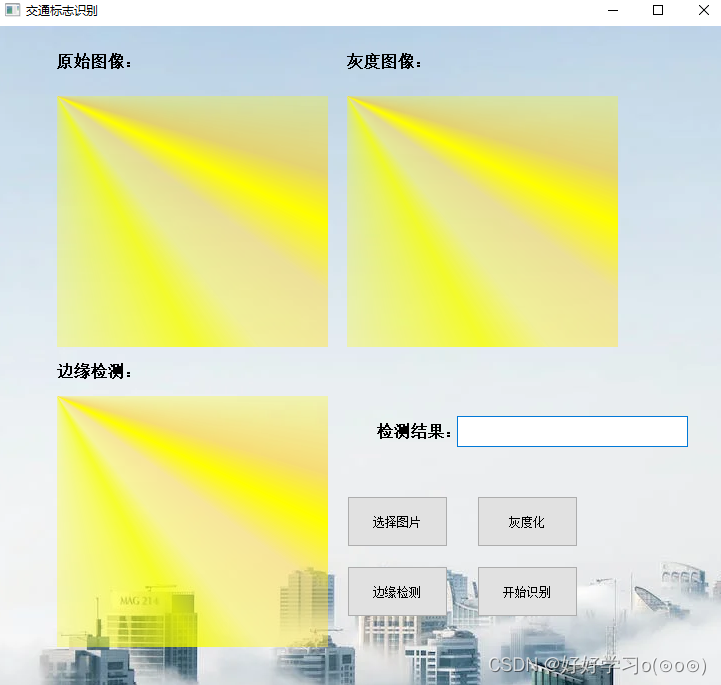
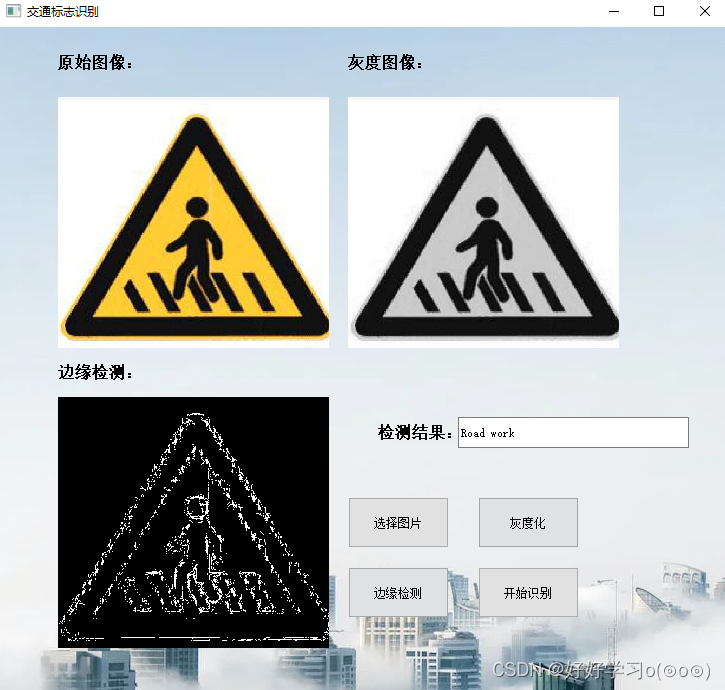
如视频中所示,可以选择交通标志,然后可以进行图像预处理操作,如灰度化,边缘检测等,最后可以点击识别按钮进行识别。
交通标志识别
数据集下载地址
数据集中共包含43种交通标志!
数据集下载地址:https://pan.baidu.com/wap/init?surl=5v14ieSPZntBTDzKVckEgA
提取码:39q4
训练模型
下面是训练模型的代码
import numpy as np
import matplotlib.pyplot as plt
from tensorflow.keras.models import Sequential
from tensorflow.keras.layers import Dense
from tensorflow.keras.optimizers import Adam
from tensorflow.python.keras.utils.np_utils import to_categorical
from tensorflow.keras.layers import Dropout, Flatten
from tensorflow.keras.layers import Conv2D, MaxPooling2D
import cv2
from sklearn.model_selection import train_test_split
import pickle
import os
import pandas as pd
import random
from tensorflow.keras.preprocessing.image import ImageDataGenerator
################# Parameters #####################
path = "./data/myData" # folder with all the class folders
labelFile = './data/labels.csv' # file with all names of classes
batch_size_val = 50 # how many to process together
steps_per_epoch_val = 446 # 迭代次数
epochs_val = 10 # 整个训练集训练次数
imageDimesions = (32, 32, 3) # 32*32的彩色图
testRatio = 0.2 # if 1000 images split will 200 for testing 测试集占比
validationRatio = 0.2 # if 1000 images 20% of remaining 800 will be 160 for validation 验证机占比
###################################################
############################### Importing of the Images 加载图像与标签
count = 0
images = []
classNo = []
myList = os.listdir(path)
print("Total Classes Detected:", len(myList))
noOfClasses = len(myList)
print("Importing Classes.....")
for x in range(0, len(myList)):
myPicList = os.listdir(path + "/" + str(count))
for y in myPicList:
curImg = cv2.imread(path + "/" + str(count) + "/" + y)
images.append(curImg)
classNo.append(count)
print(count, end=" ")
count += 1
print(" ")
# 存着对应的图片信息和标签
images = np.array(images)
classNo = np.array(classNo)
############################### Split Data 分割test集和验证集
X_train, X_test, y_train, y_test = train_test_split(images, classNo, test_size=testRatio)
X_train, X_validation, y_train, y_validation = train_test_split(X_train, y_train, test_size=validationRatio)
# X_train = ARRAY OF IMAGES TO TRAIN
# y_train = CORRESPONDING CLASS ID
############################### TO CHECK IF NUMBER OF IMAGES MATCHES TO NUMBER OF LABELS FOR EACH DATA SET
print("Data Shapes")
print("Train", end="");
print(X_train.shape, y_train.shape)
print("Validation", end="");
print(X_validation.shape, y_validation.shape)
print("Test", end="");
print(X_test.shape, y_test.shape)
assert (X_train.shape[0] == y_train.shape[
0]), "The number of images in not equal to the number of lables in training set"
assert (X_validation.shape[0] == y_validation.shape[
0]), "The number of images in not equal to the number of lables in validation set"
assert (X_test.shape[0] == y_test.shape[0]), "The number of images in not equal to the number of lables in test set"
assert (X_train.shape[1:] == (imageDimesions)), " The dimesions of the Training images are wrong "
assert (X_validation.shape[1:] == (imageDimesions)), " The dimesionas of the Validation images are wrong "
assert (X_test.shape[1:] == (imageDimesions)), " The dimesionas of the Test images are wrong"
############################### READ CSV FILE
data = pd.read_csv(labelFile)
print("data shape ", data.shape, type(data))
############################### DISPLAY SOME SAMPLES IMAGES OF ALL THE CLASSES
# 可视化部分图标及类别
num_of_samples = []
cols = 5
num_classes = noOfClasses
fig, axs = plt.subplots(nrows=num_classes, ncols=cols, figsize=(5, 300))
fig.tight_layout()
for i in range(cols):
for j, row in data.iterrows():
x_selected = X_train[y_train == j]
axs[j][i].imshow(x_selected[random.randint(0, len(x_selected) - 1), :, :], cmap=plt.get_cmap("gray"))
axs[j][i].axis("off")
if i == 2:
axs[j][i].set_title(str(j) + "-" + row["Name"])
num_of_samples.append(len(x_selected))
############################### DISPLAY A BAR CHART SHOWING NO OF SAMPLES FOR EACH CATEGORY
# 对类别分布做一个统计 饼图
print(num_of_samples)
plt.figure(figsize=(12, 4))
plt.bar(range(0, num_classes), num_of_samples)
plt.title("Distribution of the training dataset")
plt.xlabel("Class number")
plt.ylabel("Number of images")
plt.show()
############################### PREPROCESSING THE IMAGES
# 灰度
def grayscale(img):
img = cv2.cvtColor(img, cv2.COLOR_BGR2GRAY)
return img
# 直方图均衡化
def equalize(img):
img = cv2.equalizeHist(img)
return img
def preprocessing(img):
img = grayscale(img) # CONVERT TO GRAYSCALE
img = equalize(img) # STANDARDIZE THE LIGHTING IN AN IMAGE
img = img / 255 # TO NORMALIZE VALUES BETWEEN 0 AND 1 INSTEAD OF 0 TO 255
return img
# 对所有数据进行预处理
X_train = np.array(list(map(preprocessing, X_train))) # TO IRETATE AND PREPROCESS ALL IMAGES
X_validation = np.array(list(map(preprocessing, X_validation)))
X_test = np.array(list(map(preprocessing, X_test)))
#cv2.imshow("GrayScale Images",
#X_train[random.randint(0, len(X_train) - 1)]) # TO CHECK IF THE TRAINING IS DONE PROPERLY
############################### ADD A DEPTH OF 1
# 增加一维
X_train = X_train.reshape(X_train.shape[0], X_train.shape[1], X_train.shape[2], 1)
X_validation = X_validation.reshape(X_validation.shape[0], X_validation.shape[1], X_validation.shape[2], 1)
X_test = X_test.reshape(X_test.shape[0], X_test.shape[1], X_test.shape[2], 1)
############################### AUGMENTATAION OF IMAGES: TO MAKEIT MORE GENERIC
# width_shift_range 图像偏移 width_shift_range*width
# height_shift_range height_shift_range*height
# zoom_range: Float or [lower, upper]. Range for random zoom. 随机缩放范围
# shear_range: Float. Shear Intensity (Shear angle in counter-clockwise direction in degrees) # 剪切-剪切角度-逆时针剪切
# rotation_range: Int. Degree range for random rotations. 随机旋转的角度范围
dataGen = ImageDataGenerator(width_shift_range=0.1,
# 0.1 = 10% IF MORE THAN 1 E.G 10 THEN IT REFFERS TO NO. OF PIXELS EG 10 PIXELS
height_shift_range=0.1,
zoom_range=0.2, # 0.2 MEANS CAN GO FROM 0.8 TO 1.2
shear_range=0.1, # MAGNITUDE OF SHEAR ANGLE
rotation_range=10) # DEGREES
dataGen.fit(X_train)
batches = dataGen.flow(X_train, y_train,
batch_size=20) # REQUESTING DATA GENRATOR TO GENERATE IMAGES BATCH SIZE = NO. OF IMAGES CREAED EACH TIME ITS CALLED
X_batch, y_batch = next(batches)
# TO SHOW AGMENTED IMAGE SAMPLES
fig, axs = plt.subplots(1, 15, figsize=(20, 5))
fig.tight_layout()
for i in range(15):
axs[i].imshow(X_batch[i].reshape(imageDimesions[0], imageDimesions[1]))
axs[i].axis('off')
plt.show()
# one-hot
y_train = to_categorical(y_train, noOfClasses)
y_validation = to_categorical(y_validation, noOfClasses)
y_test = to_categorical(y_test, noOfClasses)
############################### CONVOLUTION NEURAL NETWORK MODEL 定义模型
# 卷积-卷积-池化 卷积-卷积-池化 drop
def myModel():
no_Of_Filters = 60
size_of_Filter = (5, 5) # THIS IS THE KERNEL THAT MOVE AROUND THE IMAGE TO GET THE FEATURES.
# THIS WOULD REMOVE 2 PIXELS FROM EACH BORDER WHEN USING 32 32 IMAGE
size_of_Filter2 = (3, 3)
size_of_pool = (2, 2) # SCALE DOWN ALL FEATURE MAP TO GERNALIZE MORE, TO REDUCE OVERFITTING
no_Of_Nodes = 500 # NO. OF NODES IN HIDDEN LAYERS
model = Sequential()
model.add((Conv2D(no_Of_Filters, size_of_Filter, input_shape=(imageDimesions[0], imageDimesions[1], 1),
activation='relu'))) # ADDING MORE CONVOLUTION LAYERS = LESS FEATURES BUT CAN CAUSE ACCURACY TO INCREASE
model.add((Conv2D(no_Of_Filters, size_of_Filter, activation='relu')))
model.add(MaxPooling2D(pool_size=size_of_pool)) # DOES NOT EFFECT THE DEPTH/NO OF FILTERS
model.add((Conv2D(no_Of_Filters // 2, size_of_Filter2, activation='relu')))
model.add((Conv2D(no_Of_Filters // 2, size_of_Filter2, activation='relu')))
model.add(MaxPooling2D(pool_size=size_of_pool))
model.add(Dropout(0.5))
model.add(Flatten())
model.add(Dense(no_Of_Nodes, activation='relu'))
model.add(Dropout(0.5)) # INPUTS NODES TO DROP WITH EACH UPDATE 1 ALL 0 NONE
model.add(Dense(noOfClasses, activation='softmax')) # OUTPUT LAYER
# COMPILE MODEL
model.compile(Adam(lr=0.001), loss='categorical_crossentropy', metrics=['accuracy'])
return model
############################### TRAIN
model = myModel()
print(model.summary())
# 开始训练
history = model.fit_generator(dataGen.flow(X_train, y_train, batch_size=batch_size_val),
steps_per_epoch=steps_per_epoch_val, epochs=epochs_val,
validation_data=(X_validation, y_validation), shuffle=1)
############################### PLOT
plt.figure(1)
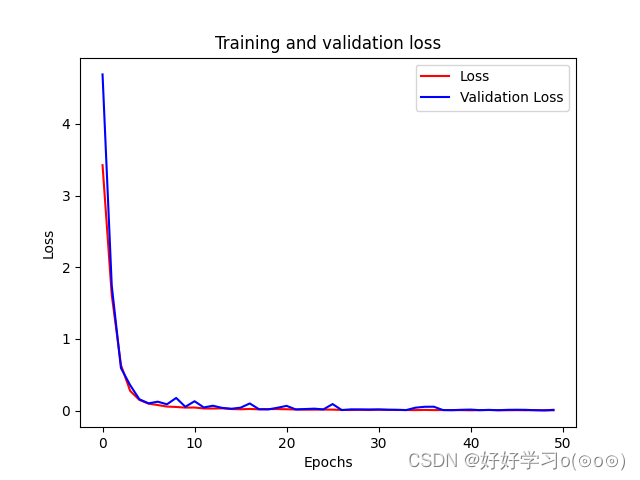
plt.plot(history.history['loss'])
plt.plot(history.history['val_loss'])
plt.legend(['training', 'validation'])
plt.title('loss')
plt.xlabel('epoch')
plt.figure(2)
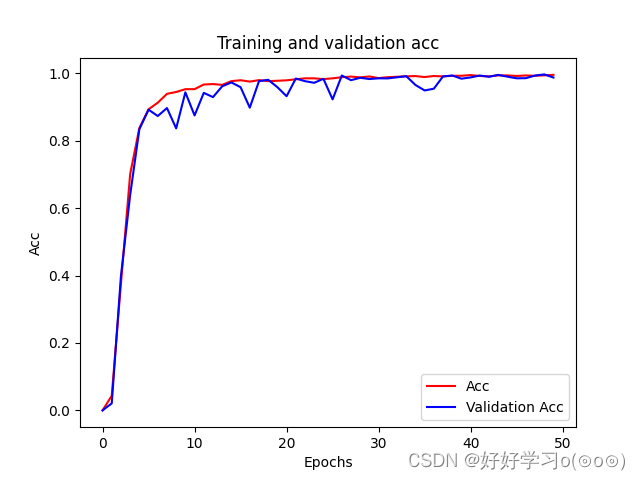
plt.plot(history.history['accuracy'])
plt.plot(history.history['val_accuracy'])
plt.legend(['training', 'validation'])
plt.title('Acurracy')
plt.xlabel('epoch')
plt.show()
# 开始评估模型
score = model.evaluate(X_test, y_test, verbose=0)
print('Test Score:', score[0])
print('Test Accuracy:', score[1])
#保持模型
model.save('traffic.h5')
# STORE THE MODEL AS A PICKLE OBJECT
# pickle_out = open("model_trained.p", "wb") # wb = WRITE BYTE
# pickle.dump(model, pickle_out)
# pickle_out.close()
# cv2.waitKey(0)
下图为模型训练的loss损失图和acc准确率图。从图像中可以看出模型的准确率还是很高的!
模型预测
下面是读取训练好的模型,预测交通标志图片的代码:
import numpy as np
import cv2
import pickle
import tensorflow as tf
#############################################
# 设置帧参数 长宽 亮度 阈值 字体
frameWidth = 640  # CAMERA RESOLUTION
frameHeight = 480
brightness = 180
threshold = 0.75  # PROBABLITY THRESHOLD
font = cv2.FONT_HERSHEY_SIMPLEX
##############################################

# SETUP THE VIDEO CAMERA
# cap = cv2.VideoCapture(0)
# cap.set(3, frameWidth)
# cap.set(4, frameHeight)
# cap.set(10, brightness)
# IMPORT THE TRANNIED MODEL
# 导入训练好的模型参数
model=tf.keras.models.load_model('traffic.h5')
# pickle_in = open("model_trained.p", "rb")  ## rb = READ BYTE
# model = pickle.load(pickle_in)


# 转灰度
def grayscale(img):
    img = cv2.cvtColor(img, cv2.COLOR_BGR2GRAY)
    return img


# 灰度图像均衡化
# https://zhuanlan.zhihu.com/p/54771264
def equalize(img):
    img = cv2.equalizeHist(img)
    return img


# 灰度均衡化归一化
def preprocessing(img):
    img = grayscale(img)
    img = equalize(img)
    img = img / 255
    return img


# 标志代表含义
def getCalssName(classNo):
    if classNo == 0:
        return 'Speed Limit 20 km/h'
    elif classNo == 1:
        return 'Speed Limit 30 km/h'
    elif classNo == 2:
        return 'Speed Limit 50 km/h'
    elif classNo == 3:
        return 'Speed Limit 60 km/h'
    elif classNo == 4:
        return 'Speed Limit 70 km/h'
    elif classNo == 5:
        return 'Speed Limit 80 km/h'
    elif classNo == 6:
        return 'End of Speed Limit 80 km/h'
    elif classNo == 7:
        return 'Speed Limit 100 km/h'
    elif classNo == 8:
        return 'Speed Limit 120 km/h'
    elif classNo == 9:
        return 'No passing'
    elif classNo == 10:
        return 'No passing for vechiles over 3.5 metric tons'
    elif classNo == 11:
        return 'Right-of-way at the next intersection'
    elif classNo == 12:
        return 'Priority road'
    elif classNo == 13:
        return 'Yield'
    elif classNo == 14:
        return 'Stop'
    elif classNo == 15:
        return 'No vechiles'
    elif classNo == 16:
        return 'Vechiles over 3.5 metric tons prohibited'
    elif classNo == 17:
        return 'No entry'
    elif classNo == 18:
        return 'General caution'
    elif classNo == 19:
        return 'Dangerous curve to the left'
    elif classNo == 20:
        return 'Dangerous curve to the right'
    elif classNo == 21:
        return 'Double curve'
    elif classNo == 22:
        return 'Bumpy road'
    elif classNo == 23:
        return 'Slippery road'
    elif classNo == 24:
        return 'Road narrows on the right'
    elif classNo == 25:
        return 'Road work'
    elif classNo == 26:
        return 'Traffic signals'
    elif classNo == 27:
        return 'Pedestrians'
    elif classNo == 28:
        return 'Children crossing'
    elif classNo == 29:
        return 'Bicycles crossing'
    elif classNo == 30:
        return 'Beware of ice/snow'
    elif classNo == 31:
        return 'Wild animals crossing'
    elif classNo == 32:
        return 'End of all speed and passing limits'
    elif classNo == 33:
        return 'Turn right ahead'
    elif classNo == 34:
        return 'Turn left ahead'
    elif classNo == 35:
        return 'Ahead only'
    elif classNo == 36:
        return 'Go straight or right'
    elif classNo == 37:
        return 'Go straight or left'
    elif classNo == 38:
        return 'Keep right'
    elif classNo == 39:
        return 'Keep left'
    elif classNo == 40:
        return 'Roundabout mandatory'
    elif classNo == 41:
        return 'End of no passing'
    elif classNo == 42:
        return 'End of no passing by vechiles over 3.5 metric tons'


# while True:
#
#     # READ IMAGE
#     success, imgOrignal = cap.read()
#
#     # PROCESS IMAGE
#     # 图片预处理
#     img = np.asarray(imgOrignal)
#     # 网络输入图片指定32*32
#     img = cv2.resize(img, (32, 32))
#     img = preprocessing(img)
#     cv2.imshow("Processed Image", img)
#     img = img.reshape(1, 32, 32, 1)
#     cv2.putText(imgOrignal, "CLASS: ", (20, 35), font, 0.75, (0, 0, 255), 2, cv2.LINE_AA)
#     cv2.putText(imgOrignal, "PROBABILITY: ", (20, 75), font, 0.75, (0, 0, 255), 2, cv2.LINE_AA)
#     # PREDICT IMAGE
#     # 预测
#     predictions = model.predict(img)
#     classIndex = model.predict_classes(img)
#     probabilityValue = np.amax(predictions)
#     # 概率大于阈值才判断有效检测
#     if probabilityValue > threshold:
#         # print(getCalssName(classIndex))
#         cv2.putText(imgOrignal, str(classIndex) + " " + str(getCalssName(classIndex)), (120, 35), font, 0.75,
#                     (0, 0, 255), 2, cv2.LINE_AA)
#         cv2.putText(imgOrignal, str(round(probabilityValue * 100, 2)) + "%", (180, 75), font, 0.75, (0, 0, 255), 2,
#                     cv2.LINE_AA)
#         cv2.imshow("Result", imgOrignal)
#
#     if cv2.waitKey(1) and 0xFF == ord('q'):
#         break

# 图片预处理

def pres(imgOrignal):

    img = np.asarray(imgOrignal)
    # 网络输入图片指定32*32
    img = cv2.resize(img, (32, 32))
    img = preprocessing(img)
    #显示预处理图像
    # cv2.imshow("Processed Image", img)
    # cv2.waitKey(0)
    img = img.reshape(1, 32, 32, 1)
    #cv2.putText(imgOrignal, "CLASS: ", (20, 35), font, 0.75, (0, 0, 255), 2, cv2.LINE_AA)
    #cv2.putText(imgOrignal, "PROBABILITY: ", (20, 75), font, 0.75, (0, 0, 255), 2, cv2.LINE_AA)
    # cv2.imshow('qw21',imgOrignal)
    # cv2.waitKey(0)
    # PREDICT IMAGE
    # 预测
    predictions = model.predict(img)
    classIndex = model.predict_classes(img)
    probabilityValue = np.argmax(predictions,axis=-1)
    # 概率大于阈值才判断有效检测
    if probabilityValue > threshold:
        # print(getCalssName(classIndex))
        return str(getCalssName(classIndex))
        # cv2.putText(imgOrignal, str(classIndex) + " " + str(getCalssName(classIndex)), (120, 35), font, 0.75,
        #             (0, 0, 255), 2, cv2.LINE_AA)
        # cv2.putText(imgOrignal, str(round(probabilityValue * 100, 2)) + "%", (180, 75), font, 0.75, (0, 0, 255), 2,
        #             cv2.LINE_AA)
        # cv2.imshow("Result", imgOrignal)
        # cv2.waitKey(0)
    else:
        return "No"

if __name__ == '__main__':
    imgOrignal = cv2.imread('img.png')
    out=pres(imgOrignal)
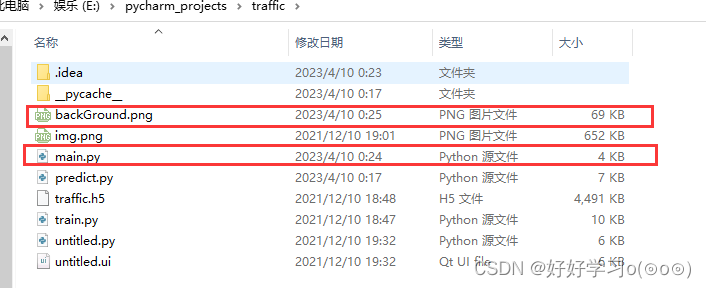
项目结构及源码下载
项目结构如下图所示,直接运行main.py即可弹出操作界面!backGround.png是界面背景图片,如果需要更换可直接替换掉该图片即可!
GUI界面如下所示:
识别效果如下所示:
项目下载:下载地址