YOLOv5源码链接:yolov5
目录
问题:
源码中的YOLOv5的7.0版本预测结果是将结果叠加一层透明度画上原图上,不管是bbox还是分割预测效果,如下所示:
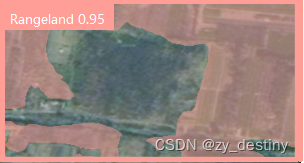
对比bbox来说画在图上比较好清晰的看到结果,那分割的预测效果如果想要实现从透明度叠加换成类似于掩膜图象的二值图或者多值图,就可以通过调整以下代码实现。
修改处1:
找到yolo-master/utils/plots.py,找到class Annotator的bbox_label函数(第100行)的else处,else下面就是给图象画框和加文字的操作了,此处可以直接注释掉,如下所示:
    def box_label(self, box, label='', color=(128, 128, 128), txt_color=(255, 255, 255)):
        # Add one xyxy box to image with label
        if self.pil or not is_ascii(label):
            self.draw.rectangle(box, width=self.lw, outline=color)  # box
            if label:
                w, h = self.font.getsize(label)  # text width, height
                outside = box[1] - h >= 0  # label fits outside box
                self.draw.rectangle(
                    (box[0], box[1] - h if outside else box[1], box[0] + w + 1,
                     box[1] + 1 if outside else box[1] + h + 1),
                    fill=color,
                )
                # self.draw.text((box[0], box[1]), label, fill=txt_color, font=self.font, anchor='ls')  # for PIL>8.0
                self.draw.text((box[0], box[1] - h if outside else box[1]), label, fill=txt_color, font=self.font)
        else:  # cv2
            pass
            # p1, p2 = (int(box[0]), int(box[1])), (int(box[2]), int(box[3]))
            # cv2.rectangle(self.im, p1, p2, color, thickness=self.lw, lineType=cv2.LINE_AA)
            # if label:
                # tf = max(self.lw - 1, 1)  # font thickness
                # w, h = cv2.getTextSize(label, 0, fontScale=self.lw / 3, thickness=tf)[0]  # text width, height
                # outside = p1[1] - h >= 3
                # p2 = p1[0] + w, p1[1] - h - 3 if outside else p1[1] + h + 3
                # cv2.rectangle(self.im, p1, p2, color, -1, cv2.LINE_AA)  # filled
                # cv2.putText(self.im,
                            # label, (p1[0], p1[1] - 2 if outside else p1[1] + h + 2),
                            # 0,
                            # self.lw / 3,
                            # txt_color,
                            # thickness=tf,
                            # lineType=cv2.LINE_AA)
修改处2:
找到yolo-master/utils/plots.py,找到class Annotator的masks函数处(第155行左右),将
mcs = (masks_color * inv_alph_masks).sum(0) * 2  # mask color summand shape(n,h,w,3)
im_gpu = im_gpu.flip(dims=[0])  # flip channel
im_gpu = im_gpu.permute(1, 2, 0).contiguous()  # shape(h,w,3)
im_gpu = im_gpu * inv_alph_masks[-1] + mcs  ##原图+预测结果
改成:
mcs = (masks_color * inv_alph_masks).sum(0) * 2 # mask color summand shape(n,h,w,3)
im_gpu = im_gpu.flip(dims=[0]) # flip channel
im_gpu = im_gpu.permute(1, 2, 0).contiguous() # shape(h,w,3)
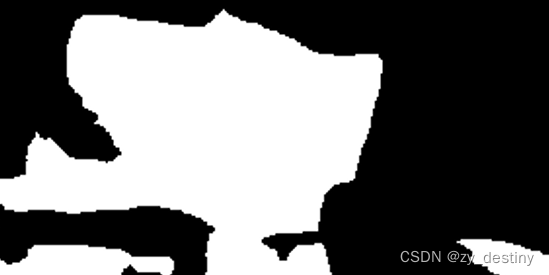
im_gpu = inv_alph_masks[-1] #只有预测结果可以看到,只要把最后一行的im_gpu换掉就好了。还有个小地方别忘了,透明度要调整成100%,因此把mask函数的输入参数alpha改成1,之前默认是0.5。
修改处3:
做完以上操作掩膜图基本已经生成了,但是细心的朋友会发现掩膜边界有一圈非多值化的值,这是因为最后预测结果有一个resize的操作,默认用的是非线性插值,在此处我们要把它改成最近邻,就不会出现不在掩膜范围内的值出现了。
修改的地方是yolo-master/utils//segment/general.py,找到的91行scale_image函数处,将cv2.resize的最后加上插值方法,此处选择最近邻,如下所示:
masks = cv2.resize(masks, (im0_shape[1], im0_shape[0]), interpolation=cv2.INTER_NEAREST)至此就大功告成,可以在预测结果里找到你要的掩膜图了。