首先安装matplotlib库(好像。。本来就有?)
用到mathku的sin函数和exp(x)函数(返回e的x次方
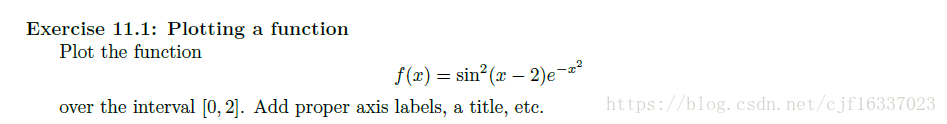
import numpy as np
import matplotlib.pyplot as plt

fig,f=plt.subplots()
x=np.linspace(0.,2.,1000)  #这个表示在-5到5之间生成1000个x值
y=(np.sin(x-2))**2*(np.exp(-x*x))	#对应函数关系
f.plot(x,y)  #用上述生成的1000个xy值对生成1000个点
f.set_xlabel(" x label")
f.set_ylabel(" y label")
f.set_title("$sin^2(x-2){e^{-x^2}}$")
plt.show()  #绘制图像
参考资料:
matplotlib命令与格式:图例legend语法及设置:
https://blog.csdn.net/helunqu2017/article/details/78641290
matplotlib.pyplot.plot()参数详解:
https://blog.csdn.net/chinwuforwork/article/details/51786967
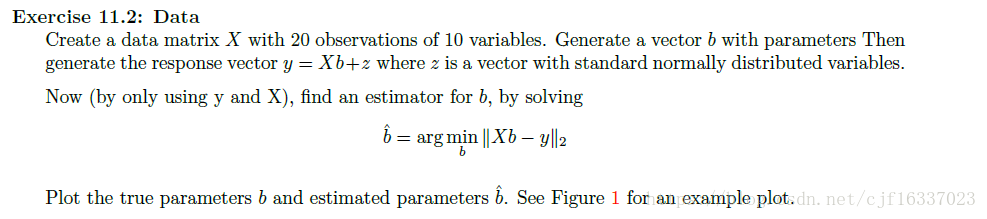
import matplotlib.pyplot as plt
import numpy as np
import numpy.matlib
import numpy.linalg

X = np.matlib.randn((20, 10))		#题设数据
b = np.matlib.randn((10, 1))
z = np.matlib.randn((20, 1))
y = X * b + z		#对应关系

x = np.linspace(0, 9, 10)
p_b, = plt.plot(x, b, 'rx', label = 'True coefficients')
B = numpy.linalg.solve(X.T*X, X.T*y)
p_B, = plt.plot(x, B, 'bo', label = 'Estimated coefficients')
plt.ylabel('index')
plt.xlabel('value')
plt.title('Parameter plot')
plt.legend(handles=[p_b, p_B],loc='upper right')
plt.show()
参考资料:
Seaborn入门系列(一)——kdeplot和distplot
https://blog.csdn.net/qq_39949963/article/details/79362501
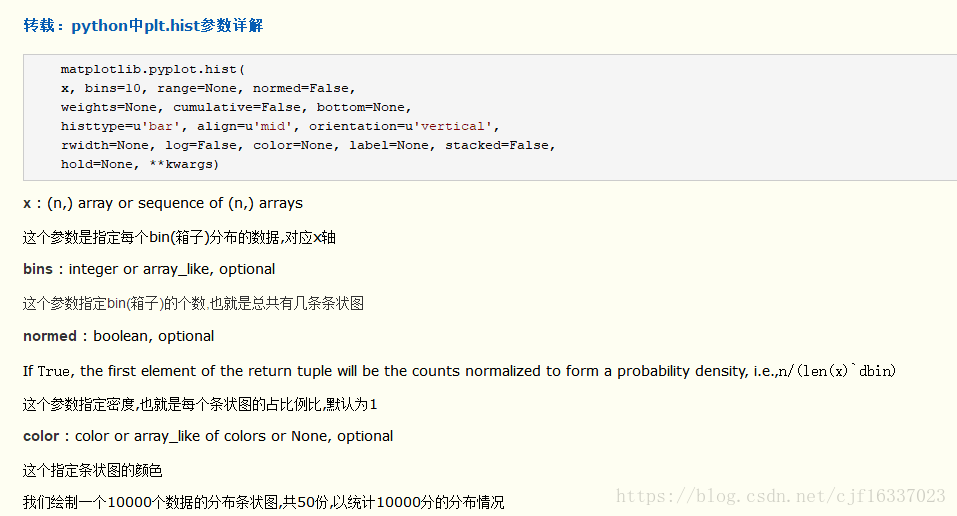
import numpy as np
import matplotlib.pyplot as plt
import seaborn

x = np.random.randn(10000)  #正态分布
plt.hist(x, 25, normed=1, facecolor='b', edgecolor = 'black')
seaborn.kdeplot(x)
plt.show()
