Matplotlib
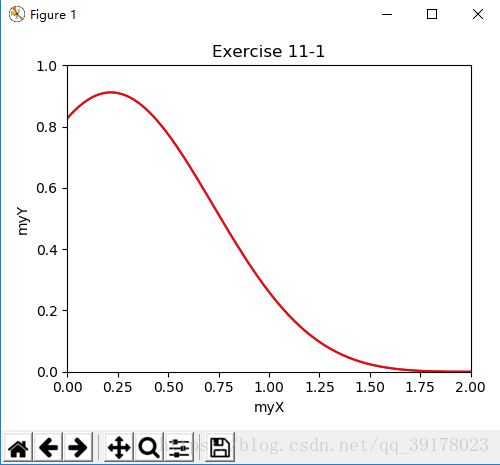
Exercise 11-1
代码
import matplotlib.pyplot as plt
import numpy as np
from math import *
figure,axes = plt.subplots(1,1,figsize=(5,4))
x_array = np.linspace(0,2,200)
y_array = np.power(np.sin(x_array - 2), 2) * np.exp(- np.power(x_array, 2))
axes.plot(x_array, y_array, label='$sin^2(x-2)*e^{-x^2}$')
axes.set_xlim((0, 2))
axes.set_ylim((0, 1))
axes.set_xlabel('myX')
axes.set_ylabel('myY')
axes.set_title('Exercise 11-1')
plt.tight_layout()
plt.plot(x_array,y_array,'r')
plt.show()
结果
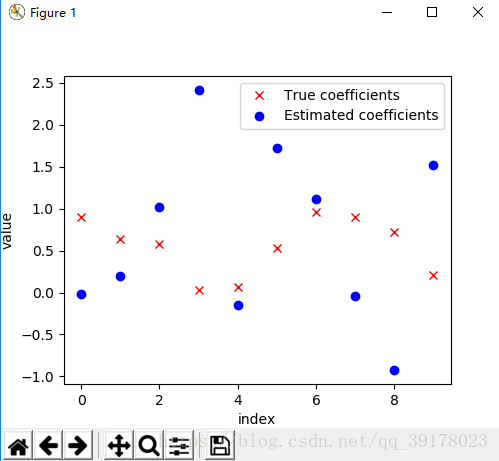
Exercise 11-2
代码
from scipy import linalg
import numpy as np
import matplotlib.pyplot as plt
matrixX = np.random.random((20,10))
vectorB = np.random.random((10,1))
vectorZ = np.random.normal(size = (20,1))
vectorY = np.dot(matrixX, vectorB) + vectorZ
estimatorB = np.linalg.lstsq(matrixX,vectorY)[0]
figure, axes = plt.subplots(1, 1, figsize = (5, 4))
axes.set_xlabel('index')
axes.set_ylabel('value')
axes.plot(vectorB, 'rx', label = 'True coefficients')
axes.plot(estimatorB, 'bo', label = 'Estimated coefficients')
plt.legend()
plt.show()
结果
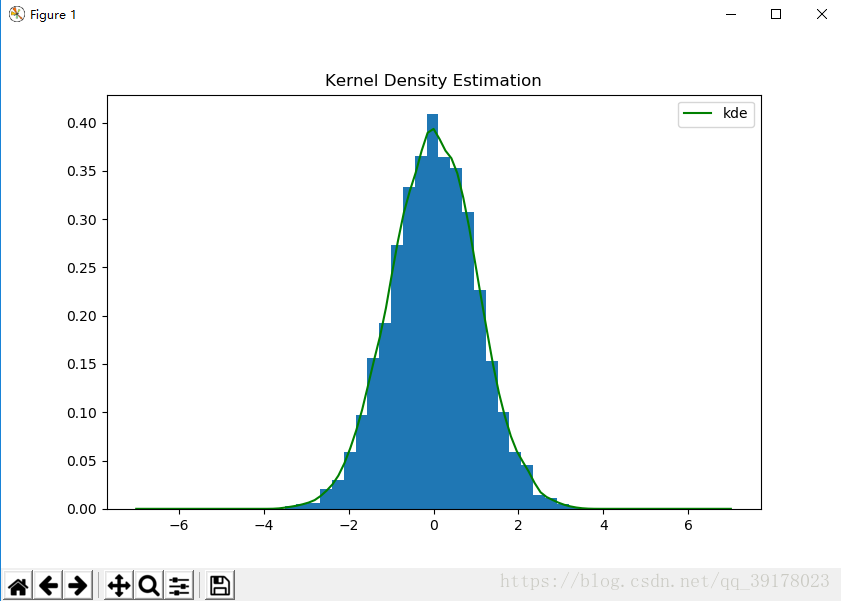
Exercise 11-3
代码
import numpy as np
from scipy import stats
import matplotlib.pylab as plt
n_basesample = 10000
np.random.seed(8765678)
xn = np.random.randn(n_basesample)
gkde=stats.gaussian_kde(xn)
ind = np.linspace(-7,7,101)
kdepdf = gkde.evaluate(ind)
figure, axes = plt.subplots(1, 1, figsize=(5,4))
axes.hist(xn, bins=25, normed=1)
axes.plot(ind, kdepdf, label='kde', color="g")
axes.set_title('Kernel Density Estimation')
plt.legend()
plt.show()
结果