import matplotlib.pyplot as plt
import numpy as np
from sklearn.cluster import KMeans
from sklearn import datasets
iris = datasets.load_iris()
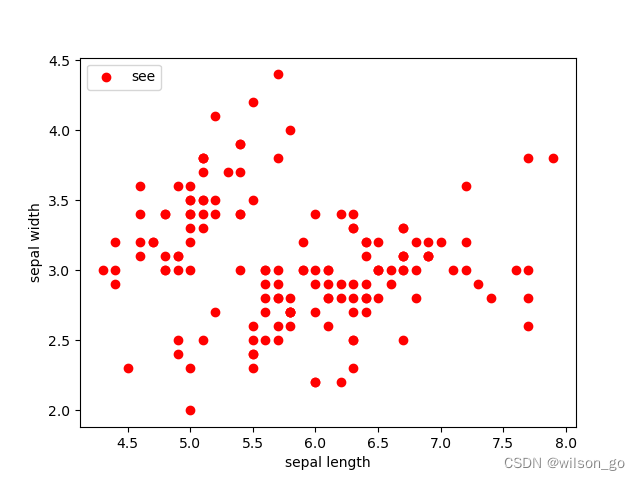
X = iris.data[:, :4]
print(X.shape)
plt.scatter(X[:, 0], X[:, 1], c="red", marker='o', label='see')
plt.xlabel('sepal length')
plt.ylabel('sepal width')
plt.legend(loc=2)
plt.show()
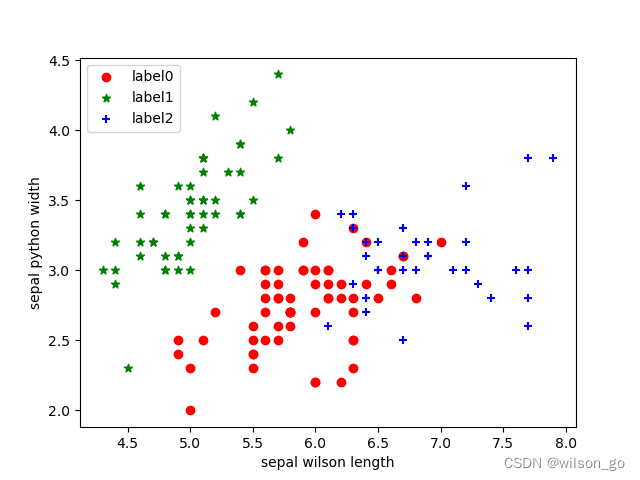
estimator = KMeans(n_clusters=3)
estimator.fit(X)
label_pred = estimator.labels_
x0 = X[label_pred == 0]
x1 = X[label_pred == 1]
x2 = X[label_pred == 2]
plt.scatter(x0[:, 0], x0[:, 1], c="red", marker='o', label='label0')
plt.scatter(x1[:, 0], x1[:, 1], c="green", marker='*', label='label1')
plt.scatter(x2[:, 0], x2[:, 1], c="blue", marker='+', label='label2')
plt.xlabel('sepal wilson length')
plt.ylabel('sepal python width')
plt.legend(loc=2)
plt.show()