效果: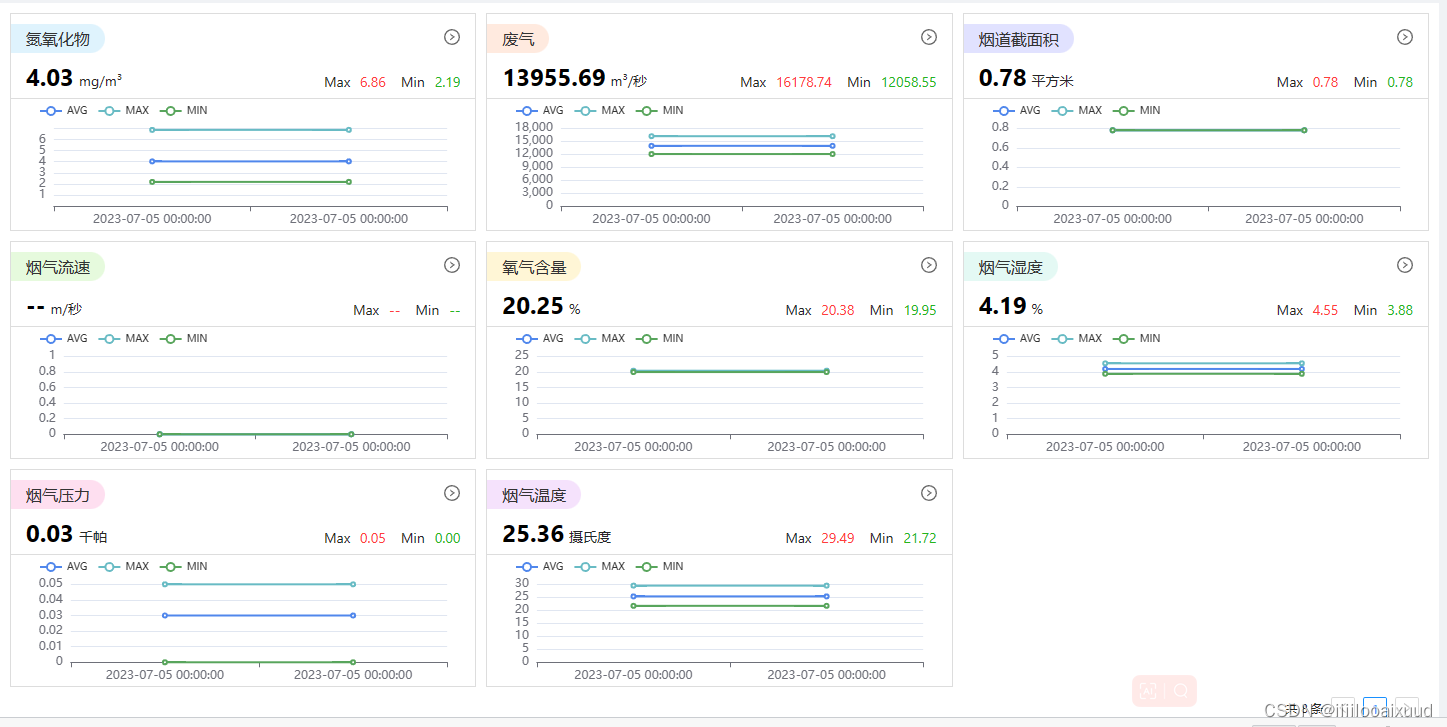
代码:
<div class="outcharbox">
                <a-row :gutter="10">
                    <a-col :span="8" v-for=" (item, index) in linesobjdata" :key="item.MonitorItemId">
                        <monitoringItemsChart :colorIndex="index" :obj="item.obj"
                            @openModal="openModal(item.MonitorItemId, item.obj)">
                            <linecharts :id="`linechart1${item.MonitorItemId}`" :dataObj="item" v-if="!item.Empty" />
                            <a-empty v-else :image="Empty.PRESENTED_IMAGE_SIMPLE" />
                        </monitoringItemsChart>
                    </a-col>
                </a-row>
            </div>
monitoringItemsChart组件:
<template>
    <div class="item-outbox">
        <div class="item-outbox-upbox">
            <div class="item-titlebox">
                <span class="item-title" :style="{ background: titlecolorList[colorIndex] }"> {

   { obj.title ? obj.title :
                    '--'
                }}</span>
                <span class="item-opendetail" @click="openModal"><right-circle-outlined /></span>
            </div>
            <div class="item-valuebox">
                <div>
                    <span class="item-value"> {

   { obj.value ? obj.value : '--' }}</span>
                    <span> {

   {obj.value ? obj?.unit :''}}</span>
                </div>
                <div class="itemmaxminbox">
                    <span class="item-maxbox"><span class="item-Max">Max</span><span class="item-maxvalue">{

   { obj?.max ?
                        obj?.max : '--' }}</span></span>
                    <span><span class="item-Max">Min</span><span class="item-minvalue">{

   { obj?.min ? obj?.min : '--'
                    }}</span></span>
                </div>
            </div>
        </div>
        <div class="item-outbox-downbox">
            <slot></slot>
        </div>
    </div>
</template>
<script setup>
import { reactive, ref, watch, toRefs } from "vue";
const props = defineProps({
    obj: {
        type: Object,
        default: () => ({
            title: '',
            max: '',
            min: '',
            value: '',
            time: '',
            unit: ''
        })


    },

    title: {
        type: String,
        default: '监控项',

    },
    maxmin: {
        type: Boolean,
        default: true
    },
    max: {
        type: Number,
        default: 100.56,
    },
    min: {
        type: Number,
        default: 100.56,
    },
    value: {
        type: Number,
        default: 100.5,
    },
    time: {
        type: String,
        default: '2023-07-05 17:00:00'
    },
    colorIndex: {
        type: Number,
        default: 0
    }

})
const emits = defineEmits([
    "openModal"
]);
const openModal = () => {
    emits("openModal");
}

let titlecolorList = ['#dff3fd', '#ffeadf', '#e1e2ff', '#e6fadd', '#fff6d6', '#e4f9f4', '#fedff0', '#f5e2fc', '#ebebeb']
</script>

<style lang="less" scoped>
.item-outbox {
    // background: #00a0e9;
    padding: 5px 0;
    margin-bottom: 10px;
    height: 27.2vh;
    min-height: 200px;
    min-width: 267px;
    border: 1px solid #dddddd;

    .item-outbox-upbox {
        height: 80px;
        border-bottom: 1px solid #dddddd;

        .item-valuebox,
        .item-titlebox {
            display: flex;
            justify-content: space-between;
            padding-right: 15px;
            padding-top: 5px;
        }

        .item-title {
            background-color: #dff3fd;
            font-size: 16px;
            padding: 2px 15px;
            border-top-right-radius: 15px;
            border-bottom-right-radius: 15px;
            color: #333;

        }

        .item-opendetail {
            color: #686868;
            font-size: 16px;
        }

        .item-valuebox {
            padding: 5px 15px;

            .item-value {
                font-size: 24px;
                color: #000000;
                font-weight: 700;
                padding-right: 5px;
            }

            .itemmaxminbox {
                margin-top: 13px;
            }

            .item-maxbox {
                margin-right: 15px;
            }

            .item-Max {
                margin-right: 10px;
            }

            .item-maxvalue {
                color: #ff3d3d
            }

            .item-minvalue {
                color: #25b51d
            }
        }

    }

    .item-outbox-downbox {
        min-height: 120px;
        height: calc(27.2vh - 80px);
        display: flex;
        align-items: center;

        :deep(.ant-empty-normal p) {
            margin-bottom: 0
        }

        :deep(.ant-empty-normal) {
            margin: 0;
            width: 100%;
        }
    }

}

</style>
linecharts组件:
<template>
<div :id="id" style="height: 90%; width: 100%"></div>
</template>
<script setup>
import { onBeforeUnmount, watch, nextTick, ref, unref } from "vue";
// import dayjs from 'dayjs';
import { init } from "echarts";
const { id, title, dataObj } = defineProps({
id: {
type: String,
default: "",
},
title: {
type: String,
default: "",
},
dataObj: {
type: Object,
default: () => ({
xname: [],
avg: [],
max: [],
min: [],
}),
},
});
let colorList = [
"#5087ec",
"#68bbc4",
"#58a55c",
"#dee124",
"#e124b0",
"#5d12a3",
"#ed1a2d",
"#39d3d3",
];
let charElc = null;
const initChart = (data) => {
const eledom = document.getElementById(id);
if (charElc === null) {
charElc = init(eledom);
}
let option = {
legend: {
data: ["AVG", "MAX", "MIN"],
orient: "horizontal",
x: "left",
padding: [0, 30, 10, 28],
textStyle: {
fontSize: 10,
},
itemHeight: 10,
itemWidth: 22,
},
title: {
text: title,
left: "left",
textStyle: {
color: "white",
},
},
tooltip: {
trigger: "axis",
formatter: function (params) {
let str = params[0].name + `<br/>`;
params.map((item, index) => {
if (index !== 1) {
str =
str +
item.marker +
" " +
item.seriesName +
` <span> </span>` +
item.value +
" " +
dataObj?.obj?.unit +
`<br/>`;
} else {
str =
str +
item.marker +
" " +
item.seriesName +
" " +
item.value +
" " +
dataObj?.obj?.unit +
`<br/>`;
}
});
return str;
},
},
grid: {
left: "6%",
right: "6%",
bottom: "3%",
top: "18%",
containLabel: true,
},
xAxis: {
// yAxis: {
type: "category",
boundaryGap: true,
// data: ['1月', '2月', '3月', '4月', '5月', '6月', '7月', '8月', '9月', '10月', '11月', '12月'],
data: dataObj?.xname,
// axisLabel: {//x轴字体
// // textStyle: { color: 'rgba(255,255,255,.8)' }
// // color: 'white'
// },
// axisLine: {//x轴线
// show: true,
// // lineStyle: { color: '#7384a1' }
// },
// nameLocation: 'end', //X轴标题位置(选项有:end,start,center)
// nameTextStyle: { //X轴标题
// color: 'yellow', //字体颜色
// fontSize: 14, //字体大小
// padding: 5 //padding用来调整位置
// },
},
yAxis: {
// xAxis: {
type: "value",
axisLabel: {
// textStyle: { color: 'whitet' }
// color: 'white'
},
axisLine: {
show: false, //Y轴线
// lineStyle: { color: '#7384a1' }
},
splitLine: {
//网格线
// lineStyle: { color: '#7384a1' },
// show: false
},
},
color: colorList,
series: [
{
name: "AVG",
type: "line",
// stack: 'Total',
// data: [12, 13, 10, 13, 9, 12, 13, 10, 13, 9, 10, 13],
data: dataObj?.avg,
smooth: true,
// itemStyle: {
// color: params => colorList[params.dataIndex]
// }
},
{
name: "MAX",
type: "line",
// stack: 'Total',
// data: [12, 13, 10, 13, 9, 12, 13, 10, 13, 9, 10, 13],
data: dataObj?.max,
smooth: true,
// itemStyle: {
// color: params => colorList[params.dataIndex]
// }
},
{
name: "MIN",
type: "line",
// stack: 'Total',
// data: [5,13, 9, 10, 13, 13, 15, 13,13, 9, 12, 10, ],
data: dataObj?.min,
smooth: true,
// itemStyle: {
// color: params => colorList[params.dataIndex]
// }
},
],
};
charElc.setOption(option);
window.addEventListener("resize", () => {
charElc.resize();
});
return charElc;
};
watch(
[dataObj],
([currData]) => {
if (currData) {
nextTick(() => {
initChart(currData);
});
}
},
{
deep: true,
immediate: true,
}
);
onBeforeUnmount(() => {
// clearInterval(timer);
window.removeEventListener("resize", () => charElc?.resize());
charElc?.dispose();
});
defineExpose({
initChart,
});
</script>