一. 安装echarts
npm install echarts --save
二. 按需加载创建一个echarts文件夹,并创建配置文件
//引入echarts
import * as echarts from 'echarts/core'

//引入柱状图,折线图
import {

     BarChart, LineChart } from 'echarts/charts'

// 引入提示框,标题,直角坐标系,数据集,内置数据转换器组件,组件后缀都为 Component
import {


    TitleComponent,
    TooltipComponent,
    GridComponent,
    DatasetComponent,
    TransformComponent
  } from 'echarts/components';

// 标签自动布局、全局过渡动画等特性
import {

     LabelLayout, UniversalTransition } from 'echarts/features';

// 引入 Canvas 渲染器,注意引入 CanvasRenderer 或者 SVGRenderer 是必须的一步
import {

     CanvasRenderer } from 'echarts/renderers';

// 注册必须的组件
echarts.use([
    TitleComponent,
    TooltipComponent,
    GridComponent,
    DatasetComponent,
    TransformComponent,
    BarChart,
    LineChart,
    LabelLayout,
    UniversalTransition,
    CanvasRenderer
]);
export default echarts
三. 在main.ts中注册
import echarts from './echarts'

const app = createApp(App)
app.config.globalProperties.$echarts = echarts
四. 封装echarts组件
<template>
	<div ref="chart" class="chart" :style="style"></div>
</template>

<script setup lang="ts">
import {

     ref, reactive, watch, nextTick, getCurrentInstance } from 'vue'
// import * as echarts from 'echarts' // 全局引用,这么写的话之前配置的按需加载文件就没作用了

// 接收值
const props = defineProps({


	option: {


		type: Object,
		default: () => {

    }
	}
})

// 定义值
const chart = ref()
const style = reactive({


	width: '100%',
	height: '400px',
	background: '#f8f8f8',
	borderRadius: '8px'
})
const instance = getCurrentInstance()
const echarts = instance.appContext.config.globalProperties.$echarts

// 定义加载函数
const initCharts = () => {


	let myChart = echarts.init(chart.value)
	myChart.setOption(props.option)
	// 当窗口大小改变时候,echarts重置大小
	window.addEventListener('resize', () => {


		myChart.resize()
	})
}

// 监听当配置项发生变化的时候,调用加载函数
watch(
	() => props.option,
	val => {


		if (Object.keys(val)) {


			nextTick(() => {


				initCharts()
			})
		}
	},
	{

     immediate: true }
)
</script>

<style lang="less" scoped></style>
五. 单独封装echarts图形配置项
import {

     reactive } from 'vue'

// 提取公共部分
const formatter = (params: any) => {


	let res = ''
	for (let i = 0; i < params.length; i++) {


		res += params[i].name + '<br />'
		res +=
			params[i].marker +
			params[i].seriesName +
			':' +
			`<span style="color: #000; padding-left: 10px; font-weight: 600">
		${

      params[i].seriesName == 'CPU(%)' ? params[i].value + '%' : params[i].value}</span>`
	}
	return res
}

// 鼠标悬浮在折线图上面的提示语
const tooltip = {


	trigger: 'axis',
	formatter
}

const grid = {


	left: '5%',
	right: '5%',
	containLabel: true
}

const yAxis = {


	type: 'value'
}

const echartData = reactive({


	optionList: [
		{


			option: {


				// 设置标题
				title: {


					text: 'CPU(%)',
					padding: 15
				},
				tooltip, // 设置鼠标悬浮在折线图上的样式
				grid, // 设置网格
				xAxis: {


					type: 'category',
					boundaryGap: false, // 设置刻度从零开始,默认是true表示刻度作为分割线
					data: ['Mon', 'Tue', 'Wed', 'Thu', 'Fri', 'Sat', 'Sun'] // 横坐标
				},
				yAxis, // 纵坐标
				series: [
					{


						name: 'CPU(%)',
						data: [15, 23, 24, 18, 35, 47, 60],
						type: 'line', // line是折线图,bar是直方图
						itemStyle: {


							color: '#4289fe' // 设置折线图小圆点颜色
						},
						areaStyle: {


							// 设置区域渐变色
							color: {


								type: 'linear', // 渐变色线性变化
								x: 0,
								y: 0,
								x2: 0,
								y2: 1,
								colorStops: [
									{

     offset: 0, color: 'rgba(66, 137, 254, 1)' }, // 顶端颜色
									{

     offset: 1, color: 'rgba(66, 137, 254, 0.11)' } // 低端颜色
								]
							}
						}
					}
				]
			},
			key: 'cpu'
		}
	]
})

export {

     echartData }
六. 使用组件
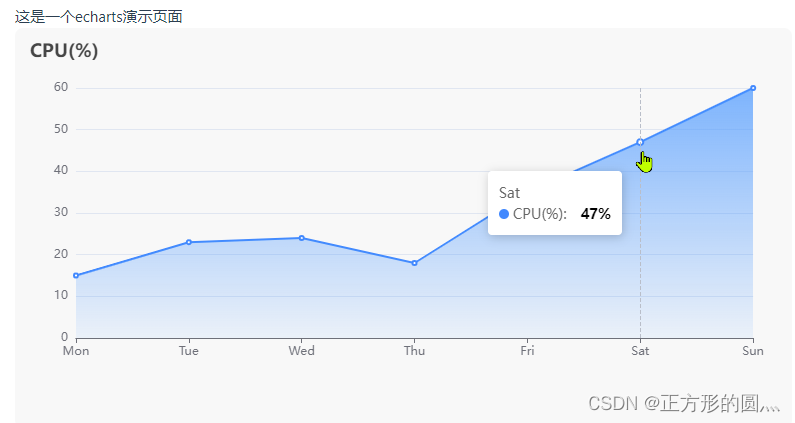
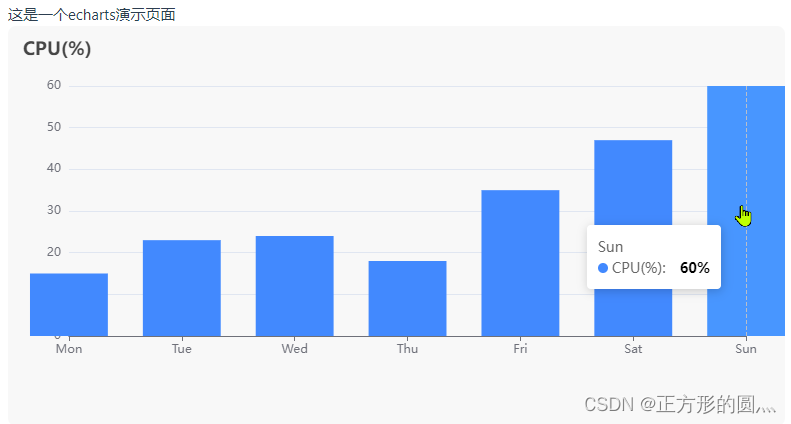
<template>
	<div>这是一个echarts演示页面</div>
	<el-row :gutter="20">
		<el-col v-for="item in state.value" :key="item.key">
			<dwchart :option="item.option" />
		</el-col>
	</el-row>
</template>

<script setup lang="ts">
import {

     reactive } from 'vue'
import dwchart from '../components/cmpts/DwEchart/index.vue'
import {

     echartData } from '../data/index'

const state = reactive<any>({

     value: [] })

// 获取数据(实际情况由接口获取数据)
const getData = () => {


	state.value = echartData.optionList
}
getData()
</script>

<style lang="less" scoped></style>
七. 效果图