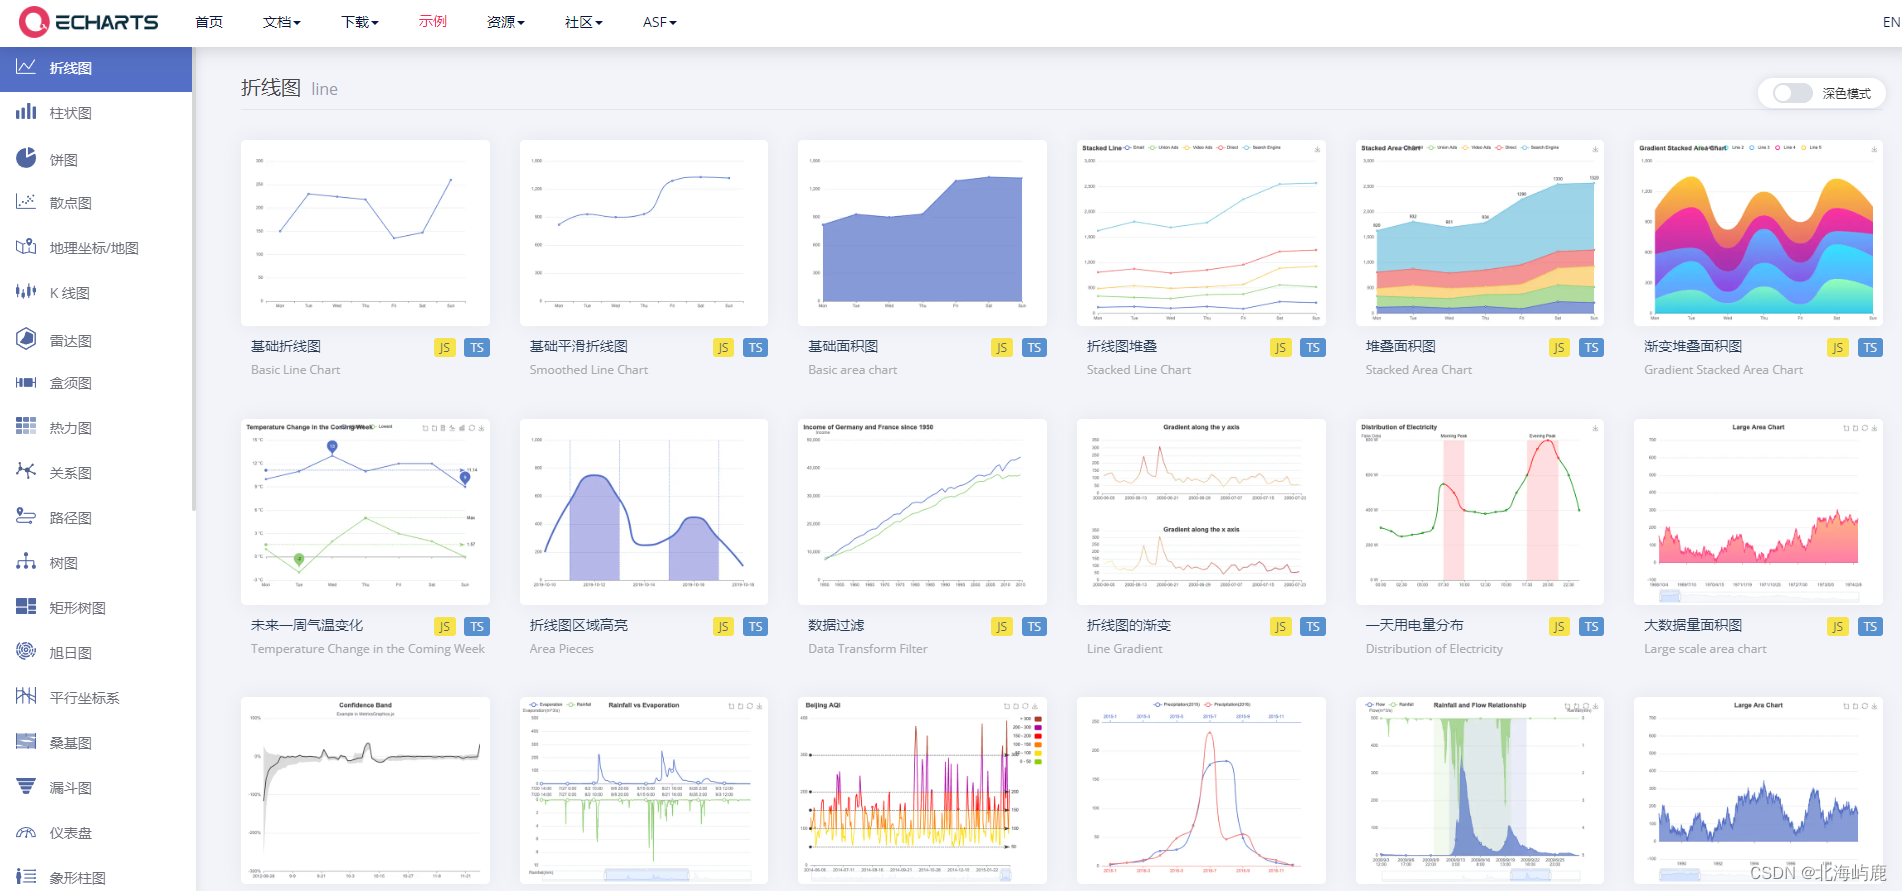
在前端做可视化项目中,不得不提到Echarts,一个专业的可视化插件

使用Echarts
- 引入包
npm install echarts --save也可以使用yarn
- 首先,我们定义一下template
<template>
  <div class="echarts-box">
    <div id="myEcharts" :style="{ width: '900px', height: '300px' }"></div>
  </div>
</template>- 其次,在文件中导入Echarts
import * as echarts from "echarts";- 然后,在script中进行使用
export default {
  name: "echartsBox",
  setup() {
    /// 声明定义一下echart
    let echart = echarts;

    onMounted(() => {
      initChart();
    });

    onUnmounted(() => {
      echart.dispose;
    });

    // 基础配置一下Echarts
    function initChart() {
      let chart = echart.init(document.getElementById("myEcharts"), "dark");
      // 把配置和数据放这里
      chart.setOption({
        xAxis: {
          type: "category",
          data: [
            "一月",
            "二月",
            "三月",
            "四月",
            "五月",
            "六月",
            "七月",
            "八月",
            "九月",
            "十月",
            "十一月",
            "十二月"
          ]
        },
        tooltip: {
          trigger: "axis"
        },
        yAxis: {
          type: "value"
        },
        series: [
          {
            data: [
              820,
              932,
              901,
              934,
              1290,
              1330,
              1320,
              801,
              102,
              230,
              4321,
              4129
            ],
            type: "line",
            smooth: true
          }
        ]
      });
      window.onresize = function() {
        //自适应大小
        chart.resize();
      };
    }

    return { initChart };
  }
};
</script>
效果图:

总结一下
在正式开发中,我们可能多处使用到Echarts,所以大家可以写一个EchartsCommon,把height、width和setOption定义为动态接收props,这样就方便调用啦!!