<!DOCTYPE html>
<html lang="en">
	<head>
		<meta charset="UTF-8">
		<title>Canvas绘制坐标系</title>
	</head>
<body>

	<div id="container">
		<canvas id="cavsElem">
			你的浏览器不支持canvas,请升级浏览器
		</canvas>
	</div>

	<script>
		(function(){
			var canvas = document.querySelector( '#cavsElem' );
			var ctx = canvas.getContext( '2d' );

			canvas.width = 600;
			canvas.height = 600;
			canvas.style.border = "1px solid #000";

			//原点坐标(100,400)
			var x0=100,y0=400;
			var arrowWith = 10;
			//绘制x轴
			ctx.beginPath();
			ctx.moveTo(x0, y0);
			ctx.lineTo( 400,400);
			ctx.lineTo( 400 - arrowWith, 400 - arrowWith);
			ctx.moveTo(400,400);
			ctx.lineTo( 400 - arrowWith, 400 + arrowWith);
			ctx.strokeStyle = 'purple';
			ctx.stroke();

			//绘制y轴
			ctx.beginPath();
			ctx.moveTo(x0, y0);
			ctx.lineTo(100,100);
			ctx.lineTo(100 - arrowWith, 100 + arrowWith);
			ctx.moveTo(100,100);
			ctx.lineTo(100 + arrowWith, 100 + arrowWith);
			ctx.strokeStyle = 'green';
			ctx.stroke();

			//绘制 点的坐标
			var data = [.1,.6,.8,.7, .4, .6];
            var maxHeight = 300;
            var maxWidth = 300;
			//每个点之间的距离
			var widthSpace = maxWidth / (data.length+1);
			ctx.beginPath();
			for( var i = 1; i <= data.length; i++ ) {
			    var x= x0 + i * widthSpace;
			    var y= y0 - data[i-1] * maxHeight;
				ctx.lineTo(x,y);
			}
			ctx.strokeStyle = 'blue';
			ctx.stroke();
		})();
	</script>
</body>
</html>
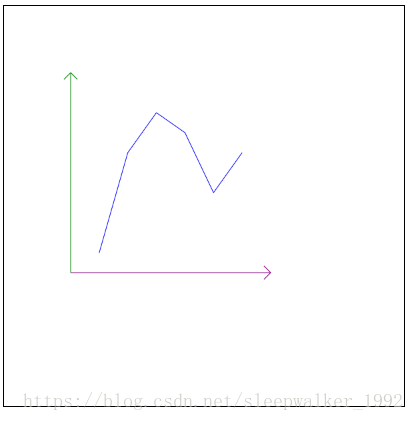
效果: