文章目录
文章目录
说明
- 本文列举了各种常用的图表
- 各种常用配置信息
可以通过下面链接测试你的demo 配置哦
https://echarts.apache.org/examples/zh/editor.html?c=area-basic
渐变色面积图

代码配置
option = {
        title: {
          text: '每天都要开心呀'
        },
        tooltip: {
          trigger: 'axis'
        },
        legend: {
          data: ['A', 'B']
        },
        grid: {
          left: '3%',
          right: '4%',
          bottom: '3%',
          containLabel: true
        },
        toolbox: {
          feature: {
            saveAsImage: {}
          }
        },
        xAxis: {
          type: 'category',
          boundaryGap: false,
          data: ['一月', '二月', '三月', '四月', '五月', '六月', '七月']
        },
        yAxis: {
          type: 'value'
        },
        series: [
          {
            name: 'A',
            type: 'line',
            data: [120, 322, 101, 134, 90,20,51],
            areaStyle: {
              color: {
                type: 'linear',
                x: 0,
                y: 0,
                x2: 0,
                y2: 1,
                colorStops: [{
                  offset: 0,  color: '#3DD5B0'  // 100% 处的颜色
                }, {
                  offset: 1, color: '#295477' //   0% 处的颜色
                }],
                global: false // 缺省为 false
              }
            },
            color: '#3DD5B0', //线条颜色
            smooth: true //线条平滑
          },
          {
            name: 'B',
            type: 'line',
            data: [220, 182, 191, 234, 290,190,60],
            areaStyle: {
              color: {
                type: 'linear',
                x: 0,
                y: 0,
                x2: 0,
                y2: 1,
                colorStops: [{
                  offset: 0,  color: '#00C6F7'  // 100% 处的颜色
                }, {
                  offset: 1, color: '#295477' //   0% 处的颜色
                }],
                global: false // 缺省为 false
              }
            },
            color: '#00C6F7', //线条颜色
            smooth: true  //线条平滑
          }
        ]
      }
如何修改图标legend样式
修改代码中legend配置即可
  legend: {
          data: ['A', 'B'],
          // top: 32,
          right: 103,
          icon: 'circle', // 修改形状
          itemHeight: 7, // 修改icon图形大小
          itemWidth: 10,
          // itemGap: 24, // 修改间距
          textStyle: {
            fontSize: 8,
            color: '#ccc',
            // padding: [0, 0, 0, -8], // 修改文字和图标距离
          },
        },
修改后的样子

如何去掉折线图小圆点
直接去除小圆点,并且鼠标放到曲线上也不显示
series: [{symbol: "none"}]
去掉小圆点,但是鼠标放到曲线上会显示
series: [{showSymbol: false}]

如何设置粗细-折线图线条设置更细或者更粗
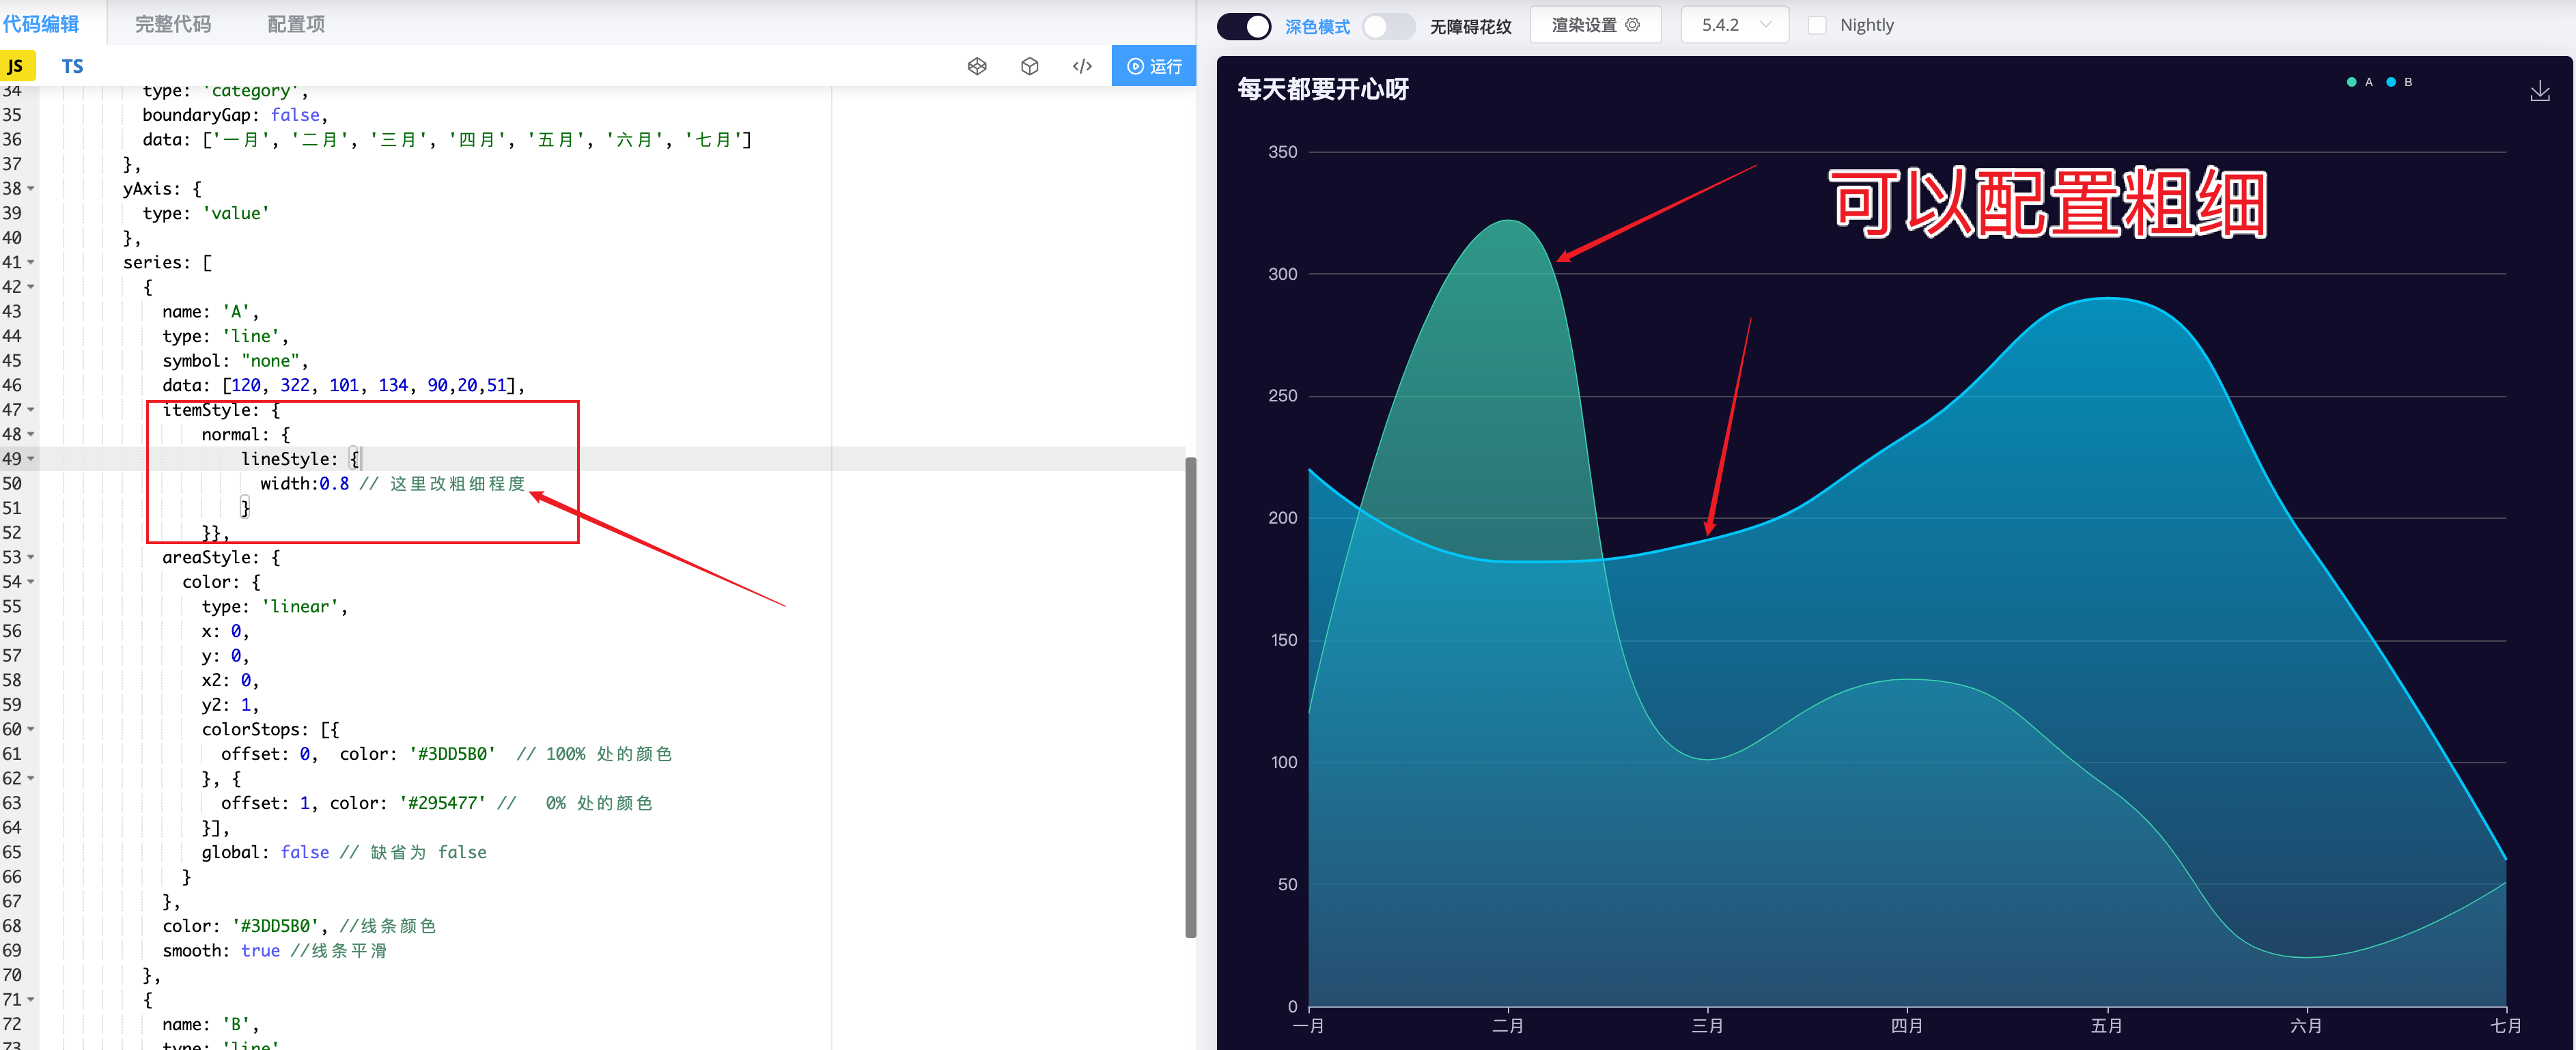
修改代码
option = {
        title: {
          text: '每天都要开心呀'
        },
        tooltip: {
          trigger: 'axis'
        },
        legend: {
          data: ['A', 'B'],
          // top: 32,
          right: 103,
          icon: 'circle', // 修改形状
          itemHeight: 7, // 修改icon图形大小
          itemWidth: 10,
          // itemGap: 24, // 修改间距
          textStyle: {
            fontSize: 8,
            color: '#ccc',
            // padding: [0, 0, 0, -8], // 修改文字和图标距离
          },
        },
        grid: {
          left: '3%',
          right: '4%',
          bottom: '3%',
          containLabel: true
        },
        toolbox: {
          feature: {
            saveAsImage: {}
          }
        },
        xAxis: {
          type: 'category',
          boundaryGap: false,
          data: ['一月', '二月', '三月', '四月', '五月', '六月', '七月']
        },
        yAxis: {
          type: 'value'
        },
        series: [
          {
            name: 'A',
            type: 'line',
            symbol: "none",
            data: [120, 322, 101, 134, 90,20,51],
            itemStyle: {
                normal: {
                    lineStyle: {
                      width:0.8 // 这里改粗细程度
                    }
                }},
            areaStyle: {
              color: {
                type: 'linear',
                x: 0,
                y: 0,
                x2: 0,
                y2: 1,
                colorStops: [{
                  offset: 0,  color: '#3DD5B0'  // 100% 处的颜色
                }, {
                  offset: 1, color: '#295477' //   0% 处的颜色
                }],
                global: false // 缺省为 false
              }
            },
            color: '#3DD5B0', //线条颜色
            smooth: true //线条平滑
          },
          {
            name: 'B',
            type: 'line',
            showSymbol: false,
            data: [220, 182, 191, 234, 290,190,60],
            areaStyle: {
              color: {
                type: 'linear',
                x: 0,
                y: 0,
                x2: 0,
                y2: 1,
                colorStops: [{
                  offset: 0,  color: '#00C6F7'  // 100% 处的颜色
                }, {
                  offset: 1, color: '#295477' //   0% 处的颜色
                }],
                global: false // 缺省为 false
              }
            },
            color: '#00C6F7', //线条颜色
            smooth: true  //线条平滑
          }
        ]
      }
如何修改X轴Y轴字体大小
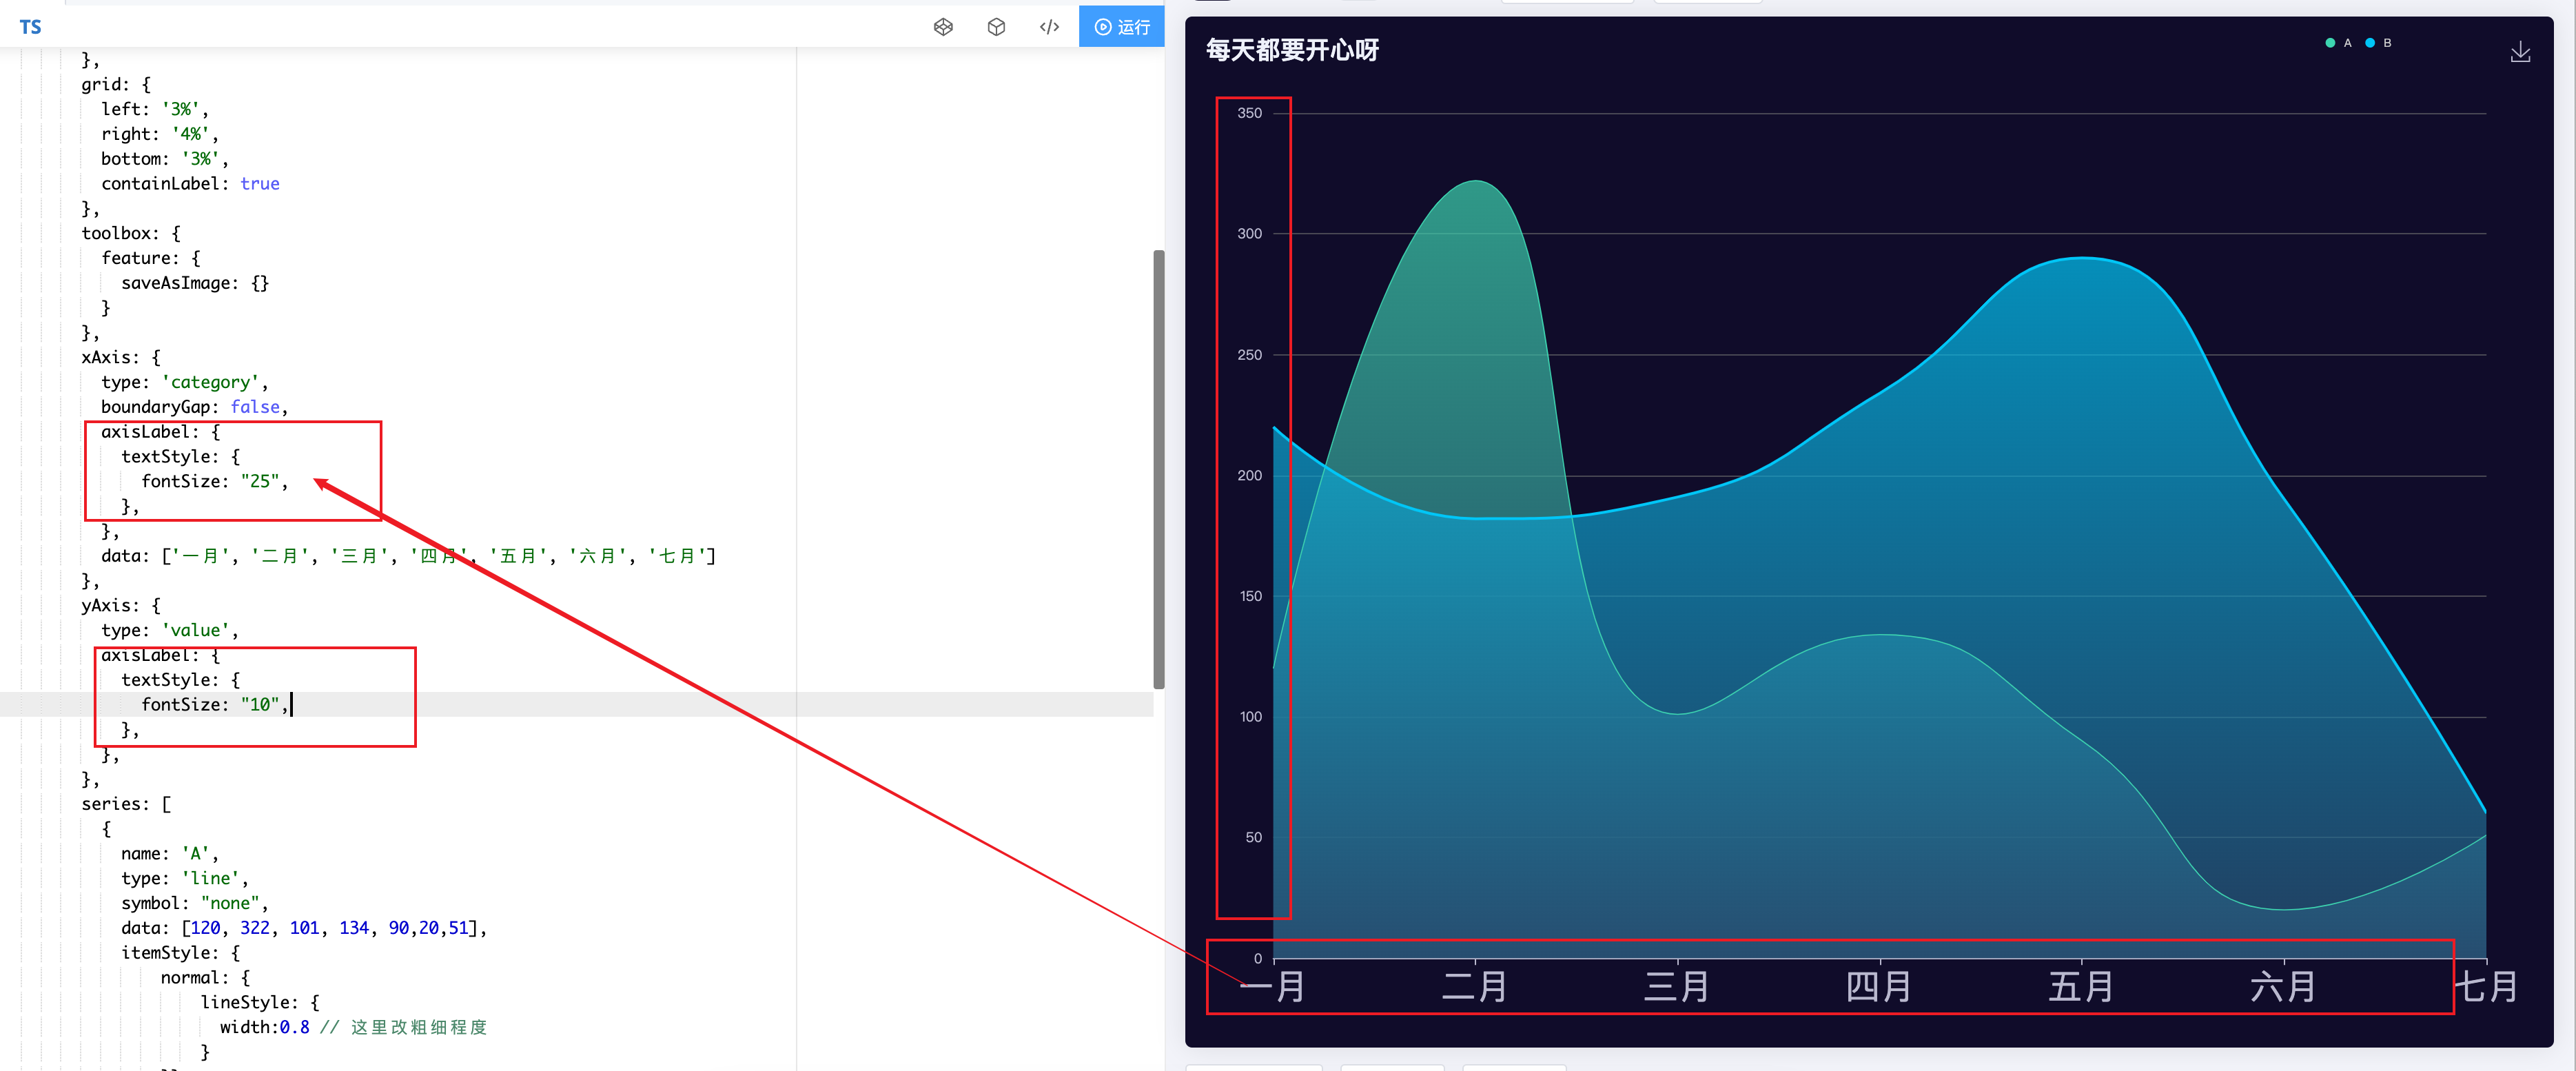
修改代码
axisLabel: {
            textStyle: {
              fontSize: "25",
            },
          },
横向渐变色柱状图

代码配置
option = {
  // title: {
  //   text: 'World Population'
  // },
  // tooltip: {
  //   trigger: 'axis',
  //   axisPointer: {
  //     type: 'shadow'
  //   }
  // },
  // legend: {},
  grid: {
    left: '3%',
    right: '4%',
    bottom: '3%',
    containLabel: true
  },
  xAxis: {
    type: 'value',
    axisLine:false,
    boundaryGap: [0, 0.01] // 避免柱子顶格,数字跑出去 echarts 柱子最大值
  },
  yAxis: {
    type: 'category',
    data: ['Brazil', 'Indonesia', 'USA', 'India', 'China', 'World']
  },
  series: [
    {
      name: '2011',
      type: 'bar',
      data: [18203, 23489, 29034, 104970, 131744, 630230],
       showBackground: true,
     itemStyle: {
                //通常情况下:
                normal: {
                    barBorderRadius: 8,
                    //每个柱子的颜色即为colorList数组里的每一项,如果柱子数目多于colorList的长度,则柱子颜色循环使用该数组
                    color: function (params) {
                        var colorList = [
                            ['rgb(14,102,179)', 'rgb(51,36,169)'],
                            ['#F5cF0D', '#fa9203'],
                            ['#61dbe8', '#0785de'],
                            ['#ff9717', '#ff4518'],
                        ];
                        var index = params.dataIndex;
                        if (params.dataIndex >= colorList.length) {
                            index = params.dataIndex - colorList.length;
                        }
                        return new echarts.graphic.LinearGradient(0, 0, 1, 0,
                            [{
                                    offset: 0,
                                    color: colorList[index][0]
                                },
                                {
                                    offset: 1,
                                    color: colorList[index][1]
                                }
                            ]);
                    }
                },
            },
      label: {
        show: true,
        position:'right',
        valueAnimation: true
      }
    }
  ]
};
自动转动炫酷百分比环形图

代码配置
let angle = 0;//角度,用来做简单的动画效果的
let value = 55.33;
option = {
backgroundColor:"#061740",
title: {
        text: '{a|'+ value +'}{c|%}',
        x: 'center',
        y: 'center',
        textStyle: {
            rich:{
                a: {
                    fontSize: 48,
                    color: '#29EEF3'
                },

                c: {
                    fontSize: 20,
                    color: '#ffffff',
                    // padding: [5,0]
                }
            }
        }
    },
    legend: {
        type: "plain",
        orient: "vertical",
        right: 0,
        top: "10%",
        align: "auto",
        data: [{
            name: '涨价后没吃过',
            icon: "circle"
        }, {
            name: '天天吃',
            icon: "circle"
        }, {
            name: '三五天吃一次',
            icon: "circle"
        }, {
            name: '半个月吃一次',
            icon: "circle"
        }],
        textStyle: {
            color: "white",
            fontSize: 16,
            padding: [10, 1, 10, 0]
        },
        selectedMode:false
    },
    series: [ {
            name: "ring5",
            type: 'custom',
            coordinateSystem: "none",
            renderItem: function(params, api) {
                return {
                    type: 'arc',
                    shape: {
                        cx: api.getWidth() / 2,
                        cy: api.getHeight() / 2,
                        r: Math.min(api.getWidth(), api.getHeight()) / 2 * 0.6,
                        startAngle: (0+angle) * Math.PI / 180,
                        endAngle: (90+angle) * Math.PI / 180
                    },
                    style: {
                        stroke: "#0CD3DB",
                        fill: "transparent",
                        lineWidth: 1.5
                    },
                    silent: true
                };
            },
            data: [0]
        }, {
            name: "ring5",
            type: 'custom',
            coordinateSystem: "none",
            renderItem: function(params, api) {
                return {
                    type: 'arc',
                    shape: {
                        cx: api.getWidth() / 2,
                        cy: api.getHeight() / 2,
                        r: Math.min(api.getWidth(), api.getHeight()) / 2 * 0.6,
                        startAngle: (180+angle) * Math.PI / 180,
                        endAngle: (270+angle) * Math.PI / 180
                    },
                    style: {
                        stroke: "#0CD3DB",
                        fill: "transparent",
                        lineWidth: 1.5
                    },
                    silent: true
                };
            },
            data: [0]
        }, {
            name: "ring5",
            type: 'custom',
            coordinateSystem: "none",
            renderItem: function(params, api) {
                return {
                    type: 'arc',
                    shape: {
                        cx: api.getWidth() / 2,
                        cy: api.getHeight() / 2,
                        r: Math.min(api.getWidth(), api.getHeight()) / 2 * 0.65,
                        startAngle: (270+-angle) * Math.PI / 180,
                        endAngle: (40+-angle) * Math.PI / 180
                    },
                    style: {
                        stroke: "#0CD3DB",
                        fill: "transparent",
                        lineWidth: 1.5
                    },
                    silent: true
                };
            },
            data: [0]
        }, {
            name: "ring5",
            type: 'custom',
            coordinateSystem: "none",
            renderItem: function(params, api) {
                return {
                    type: 'arc',
                    shape: {
                        cx: api.getWidth() / 2,
                        cy: api.getHeight() / 2,
                        r: Math.min(api.getWidth(), api.getHeight()) / 2 * 0.65,
                        startAngle: (90+-angle) * Math.PI / 180,
                        endAngle: (220+-angle) * Math.PI / 180
                    },
                    style: {
                        stroke: "#0CD3DB",
                        fill: "transparent",
                        lineWidth: 1.5
                    },
                    silent: true
                };
            },
            data: [0]
        }, {
            name: "ring5",
            type: 'custom',
            coordinateSystem: "none",
            renderItem: function(params, api) {
                let x0 = api.getWidth() / 2;
                let y0 = api.getHeight() / 2;
                let r = Math.min(api.getWidth(), api.getHeight()) / 2 * 0.65;
                let point = getCirlPoint(x0, y0, r, (90+-angle))
                return {
                    type: 'circle',
                    shape: {
                        cx: point.x,
                        cy: point.y,
                        r: 4
                    },
                    style: {
                        stroke: "#0CD3DB",//粉
                        fill: "#0CD3DB"
                    },
                    silent: true
                };
            },
            data: [0]
        }, {
            name: "ring5",  //绿点
            type: 'custom',
            coordinateSystem: "none",
            renderItem: function(params, api) {
                let x0 = api.getWidth() / 2;
                let y0 = api.getHeight() / 2;
                let r = Math.min(api.getWidth(), api.getHeight()) / 2 * 0.65;
                let point = getCirlPoint(x0, y0, r, (270+-angle))
                return {
                    type: 'circle',
                    shape: {
                        cx: point.x,
                        cy: point.y,
                        r: 4
                    },
                    style: {
                        stroke: "#0CD3DB",      //绿
                        fill: "#0CD3DB"
                    },
                    silent: true
                };
            },
            data: [0]
        }, {
            name: '吃猪肉频率',
            type: 'pie',
            radius: ['58%', '45%'],
            silent: true,
            clockwise: true,
            startAngle: 90,
            z: 0,
            zlevel: 0,
            label: {
                normal: {
                    position: "center",

                }
            },
            data: [{
                    value: value,
                    name: "",
                    itemStyle: {
                        normal: {
                            color: { // 完成的圆环的颜色
                                colorStops: [{
                                    offset: 0,
                                    color: '#4FADFD' // 0% 处的颜色
                                }, {
                                    offset: 1,
                                    color: '#28E8FA' // 100% 处的颜色
                                }]
                            },
                        }
                    }
                },
                {
                    value: 100-value,
                    name: "",
                    label: {
                        normal: {
                            show: false
                        }
                    },
                    itemStyle: {
                        normal: {
                            color: "#173164"
                        }
                    }
                }
            ]
        },

        {
            name: "",
            type: "gauge",
            radius: "58%",
            center: ['50%', '50%'],
            startAngle: 0,
            endAngle: 359.9,
            splitNumber: 8,
            hoverAnimation: true,
            axisTick: {
                show: false
            },
            splitLine: {
                length: 60,
                lineStyle: {
                    width: 5,
                    color: "#061740"
                }
            },
            axisLabel: {
                show: false
            },
            pointer: {
                show: false
            },
            axisLine: {
                lineStyle: {
                    opacity: 0
                }
            },
            detail: {
                show: false
            },
            data: [{
                value: 0,
                name: ""
            }]
        },

    ]
};

function getCirlPoint(x0, y0, r, angle) {
    let x1 = x0 + r * Math.cos(angle * Math.PI / 180)
    let y1 = y0 + r * Math.sin(angle * Math.PI / 180)
    return {
        x: x1,
        y: y1
    }
}

function draw(){
    angle = angle+3
    myChart.setOption(option, true)
   //window.requestAnimationFrame(draw);
}

setInterval(function() {
    draw()
}, 100);
渐变色仪表盘

代码配置
option = {
    backgroundColor: "#072B79",
    tooltip: {
        formatter: "{b}{c}"
    },
    series: [{
        tooltip: {
            show: false
        },
        "name": 'wrap',
        "type": 'pie',
        "hoverAnimation": false,
        "legendHoverLink": false,
        center: ['50%','60%'],
        "radius": ['0%', '7%'],
        "z": 5,
        "label": {
            "normal": {
                "show": false,
                "position": 'center'
            },
            "emphasis": {
                "show": false
            }
        },
        "labelLine": {
            "normal": {
                "show": false
            }
        },
        "data": [{
            "value": 100,
            itemStyle: {
                normal: {
                    color: "#072B79"
                },
                emphasis: {
                    color: "#072B79"
                }
            }
        }]
    }, {
        tooltip: {
            show: false
        },
        "name": 'wrap',
        "type": 'pie',
        "hoverAnimation": false,
        "legendHoverLink": false,
        center: ['50%','60%'],
        "radius": ['6%', '8%'],
        "z": 5,
        "label": {
            "normal": {
                "show": false,
                "position": 'center'
            },
            "emphasis": {
                "show": false
            }
        },
        "labelLine": {
            "normal": {
                "show": false
            }
        },
        "data": [{
            "value": 100,
            itemStyle: {
                normal: {
                    color: "#24D8E7"
                },
                emphasis: {
                    color: "#24D8E7"
                }
            }
        }]
    }, {
        tooltip: {
            show: false
        },
        name: '刻度',
        type: 'gauge',
        radius: '83%',
        z: 1,
        min: 0,
        max: 1,
        center: ['50%','60%'],
        splitNumber: 5, //刻度数量
        startAngle: 180,
        endAngle: 0,
        axisLine: {
            show: true,
            lineStyle: {
                width: 5,
                color: [
                    [0.12, '#E71A6D'],
                    [0.35, '#F88168'],
                    [0.63, '#FBF76B'],
                    [0.8, '#7AD4DF'],
                    [1, '#70C27E'],
                ]
            }
        }, //仪表盘轴线
        axisLabel: {
            show: false
        }, //刻度标签。
        axisTick: {
            show: true,
            lineStyle: {
                color: 'auto',
                width: 0
            },
            length: -15
        }, //刻度样式
        splitLine: {
            show: true,
            length: 0,
            lineStyle: {
                color: 'auto',
                width: 2
            }
        }, //分隔线样式
        detail: {
            show: false
        },
        pointer: {
            show: false
        }
    }, {
        name: '本期',
        type: 'gauge',
        radius: '80%',
        min: 0,
        max: 1,
        center: ['50%','60%'],
        data: [{
            value: 0.89,
            name: '本期'
        }],
        splitNumber: 12, //刻度数量
        startAngle: 180,
        endAngle: 0,
        z: 5,
        axisLine: {
            show: true,
            lineStyle: {
                width: 0,
                color: [
                    [0.12, '#E71A6D'],
                    [0.35, '#F88168'],
                    [0.63, '#FBF76B'],
                    [0.8, '#7AD4DF'],
                    [1, '#70C27E'],
                ]
            }
        }, //仪表盘轴线
        axisLabel: {
            show: true,
            color: '#fff',
            fontSize:20,
            distance: -70,
            formatter:function(params){
                var value = params.toFixed(2)

                if(value == 0.00){
                    return '危'
                }else if(value == 0.25){
                    return '差'
                }else if(value == 0.50){
                    return '中'
                }else if(value == 0.75){
                    return '良'
                }else if(value == 1.00){
                    return '优'
                }else{
                    return ''
                }
            }
        }, //刻度标签。
        axisTick: {
            splitNumber: 10,
            show: true,
            lineStyle: {
                color: 'auto',
                width: 2
            },
            length: 20,
        }, //刻度样式
        splitLine: {
            show: true,
            length: 25,
            lineStyle: {
                color: 'auto',
                width: 5
            }
        }, //分隔线样式

        "itemStyle": {
            "normal": {
                "color": "#24D8E7" //指针颜色
            }
        },
        pointer: {
            width: 10,
            length: '80%'
        },
        detail: {
            formatter: function(params){
                return (params*100).toFixed(0) + '%'
            },
            fontSize: 50,
            color: "#fff",
            offsetCenter: ['0%', '-35%']
        },
        title: {
            offsetCenter: ['0', '-60%'],
            fontSize: 40,
            color: "#fff",
            show: true
        },
    }]
};
简约风格圆环百分比仪表盘图

代码配置
option = {
    backgroundColor: "#072B79",
    tooltip: {
        formatter: "{b}{c}"
    },

    series: [  {
        name: '',
        type: 'gauge',
        radius: '80%',
        min: 0,
        max: 1,
        center: ['50%','60%'],
        data: [{
            value: 0.89,
            name: '本期'
        }],
        splitNumber: 8, //刻度数量
        startAngle: 210,
        endAngle: -50,
        z: 12,
        axisLine: {
            show: true,
            lineStyle: {
                width: 0,
                color: [
                    [0.01, '#E71A6D'],
                    [0.35, '#F88168'],
                     [0.55, '#E71A6D'],
                    [0.85, '#F88168'],
                     [0.92, '#E71A6D'],
                ]
            }
        }, //仪表盘轴线
        axisLabel: {
            show: false,
        }, //刻度标签。
        axisTick: {
            splitNumber: 10,
            show: true,
            lineStyle: {
                color: 'auto',
                width: 5
            },
            length: 30,
        }, //刻度样式
        splitLine: {
            show: false,
        }, //分隔线样式

        "itemStyle": {
            "normal": {
                "color": "#24D8E7" //指针颜色
            }
        },
        pointer: {
          show:false,
            width: 10,
            length: '80%'
        },
        detail: {
            formatter: function(params){
                return (params*100).toFixed(0) + '%'
            },
            fontSize: 120,
            color: "#fff",
            offsetCenter: ['0%', '0%']
        },
        title: {

            show: false
        },
    }]
};
双柱渐变色柱状图

代码配置
// prettier-ignore
let dataAxis = [ '在', '触', '屏', '上'];
// prettier-ignore
let data = [220, 182, 191, 234,];
let yMax = 500;
let dataShadow = [];
for (let i = 0; i < data.length; i++) {
  dataShadow.push(yMax);
}
option = {
  title: {
    text: 'Times',
  },
  xAxis: {
    data: dataAxis,
    axisLabel: {
      // inside: true,
      color: 'red'
    },
    axisTick: {
      show: false
    },
    axisLine: {
      show: false
    },
    z: 10
  },
  yAxis: {
    axisLine: {
      show: false
    },
    axisTick: {
      show: false
    },
    axisLabel: {
      color: '#999'
    }
  },
  legend: {
    show: true
  },
  dataZoom: [
    {
      type: 'inside'
    }
  ],
  series: [

    {
       name: '2011',
      type: 'bar',
      barWidth:20,
      showBackground: false,
      itemStyle: {
         barBorderRadius: 8,

        color: new echarts.graphic.LinearGradient(0, 1, 0, 0, [
          { offset: 0, color: '#83bff6' },
          { offset: 0.5, color: '#188df0' },
          { offset: 1, color: '#188df0' }
        ])
      },
      data: data
    },{
       name: '2012',
      type: 'bar',
      barWidth:20,
      barGap:'150%',//柱图间距
      showBackground: false,
      itemStyle: {
         barBorderRadius: 8,

        color: new echarts.graphic.LinearGradient(0, 1, 0, 0, [
          { offset: 0, color: 'blue' },
          { offset: 0.5, color: '#188df0' },
          { offset: 1, color: '#188df0' }
        ])
      },
      data: data
    }
  ]
};
// Enable data zoom when user click bar.
const zoomSize = 6;
圆环占比百分比图(环形图)
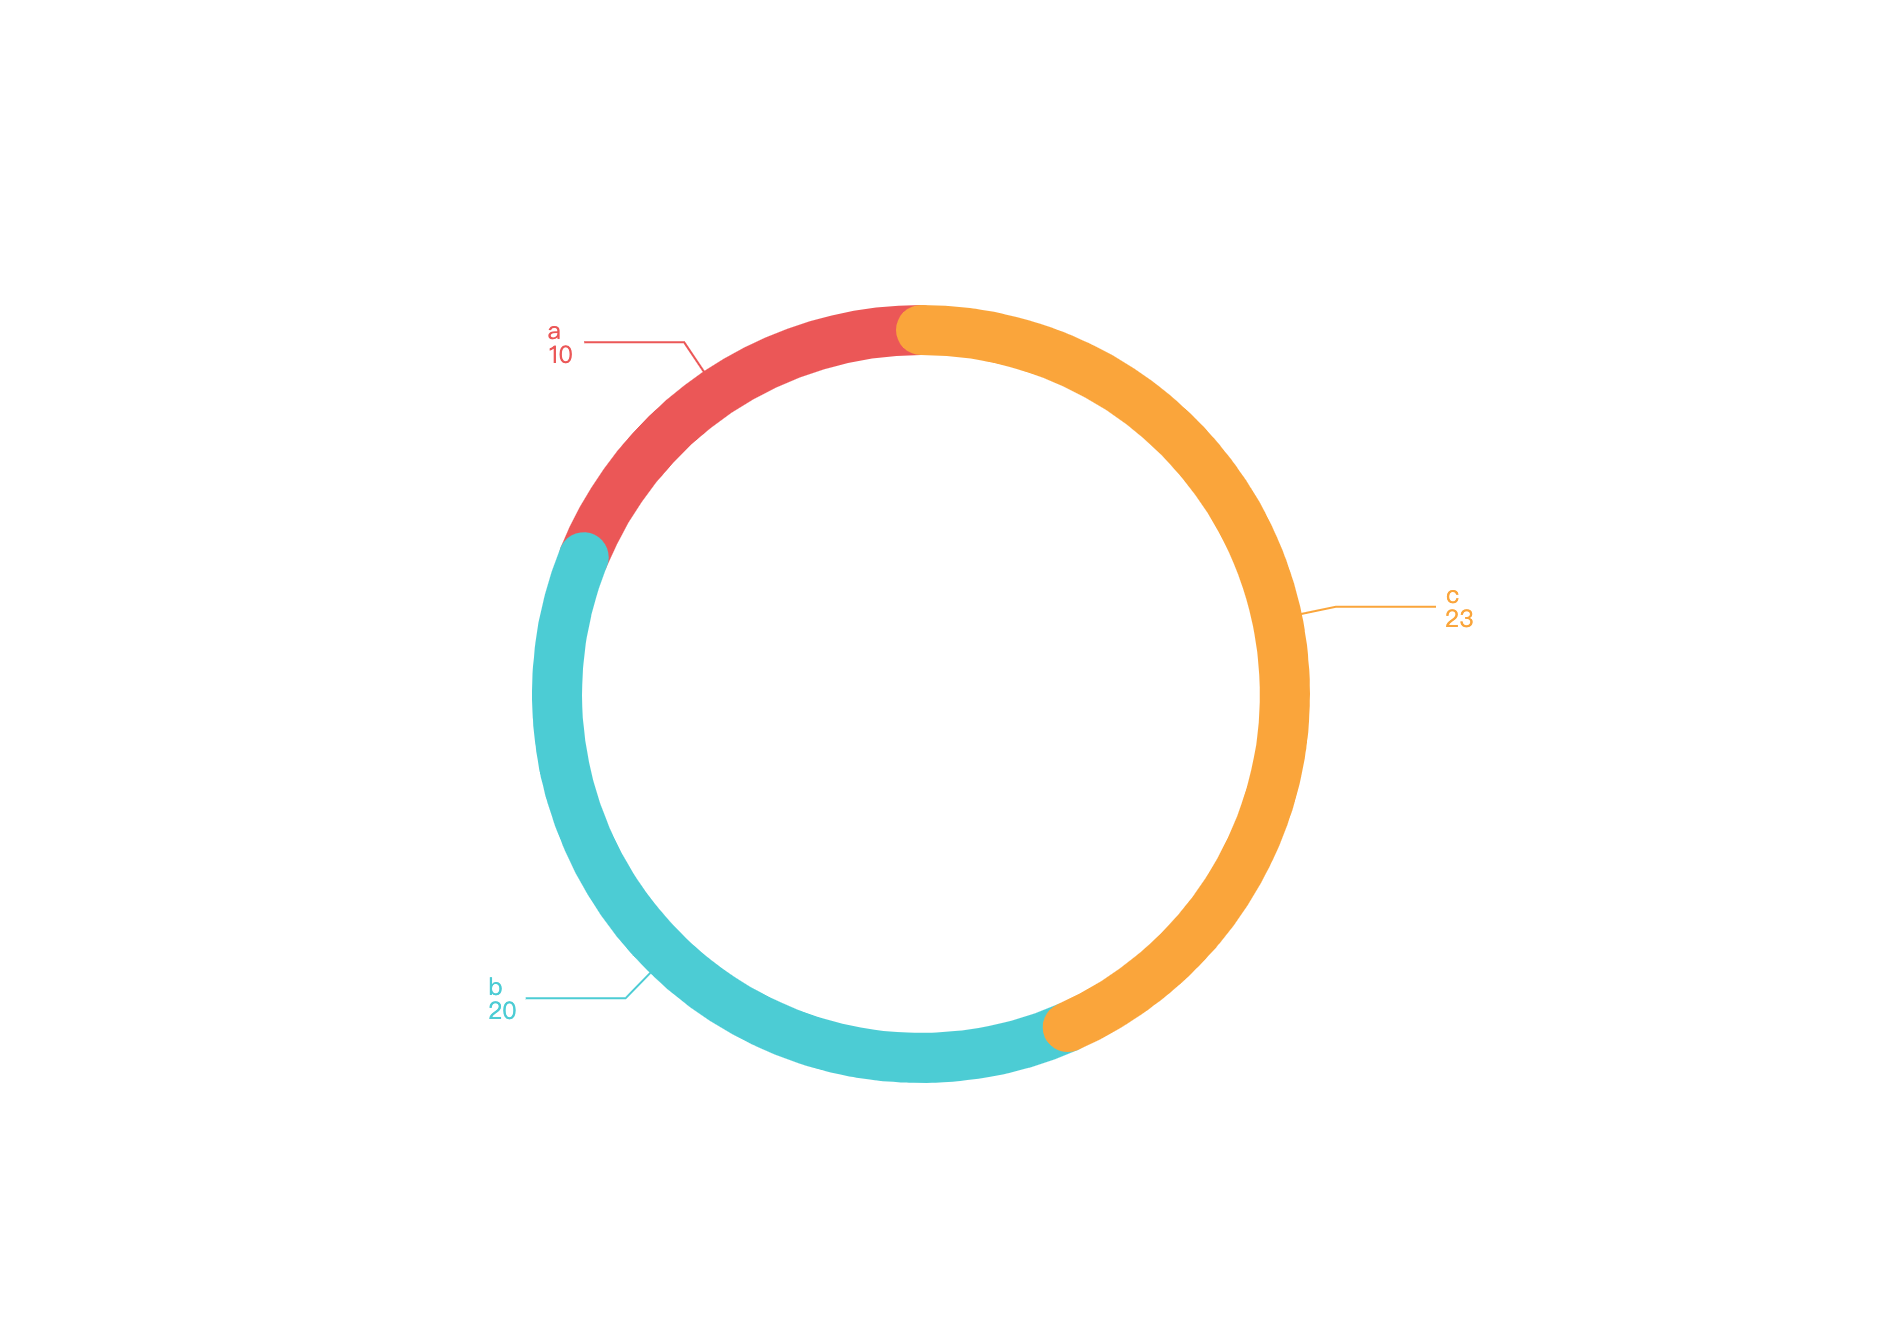
代码配置
let color = ["#EB5757", "#4CCCD4", "#FAA53B"];
        let data = [];
        let data1 = [{name:'a',value:10},{name:'b',value:20,},{name:'c',value:23}]
        for (let i = 0; i < data1.length; i++) {
                data.push({
                        value: data1[i].value,
                        name: data1[i].name,
                        itemStyle: {
                                normal: {
                                        borderWidth: 25,
                                        // shadowBlur: 5,
                                        borderColor: color[i],
                                        shadowColor: color[i]
                                }
                        }
                });
        }
option =
{
    backgroundColor: "white",
    color: color,
    title: {
        top: "48%",
        left: "49%",
        textAlign: "center"
    },
    tooltip: {
        show: false
    },
    toolbox: {
        show: false
    },
    series: [
        {
            name: "",
            type: "pie",
            clockWise: false,
            radius: ["50%", "50%"],
            hoverAnimation: false,
            itemStyle: {
                normal: {
                    label: {
                        show: true,
                        position: "outside",
                        overflow: "none",
                        color: "inherit",
                        align: "center",
                        rich: {
                            a1: {
                                align: "center"
                            }
                        },
                        formatter: function (params) {
                            console.log(params, "每一个的值");
                            return `{a1|${params.name}}  \n` + `{a1|${params.value}}`;
                        }
                    },
                    labelLine: {
                        length: 30,
                        length2: 50,
                        // maxSurfaceAngle: 90,
                        show: true,
                        color: "#00ffff"
                    }
                }
            },
            data: data
        }
    ]
}
横向渐变色柱状图(去除刻度线)

代码配置
 option = {
  // title: {
  //   text: 'World Population'
  // },
  // tooltip: {
  //   trigger: 'axis',
  //   axisPointer: {
  //     type: 'shadow'
  //   }
  // },
  // legend: {},
  grid: {
    left: '3%',
    right: '4%',
    bottom: '3%',
    top: '3%',
    containLabel: true,
  },
  xAxis: {
    type: 'value',
    axisLine: false,
    splitLine:{show: false}, // 控制 背景网格线
    // boundaryGap: [0, 0.01],
  },
  yAxis: {
    type: 'category',
    data: ['5', '4', '3', '2', '1'],

        "axisTick":{       // 控制 y轴刻度线

          "show":false

        },
         "axisLine":{       //控制y轴线
          "show":false

        },

  },
  series: [
    {
      name: '2011',
      type: 'bar',
      barWidth:12,// 控制柱子粗细
      data: [18203, 23489, 29034, 104970, 131744, 630230],
      showBackground: true,
      itemStyle: {
        // 通常情况下:
        normal: {
          barBorderRadius: 8,
          // 每个柱子的颜色即为colorList数组里的每一项,如果柱子数目多于colorList的长度,则柱子颜色循环使用该数组
          color(params) {
            const colorList = [
              ['rgb(14,102,179)', 'rgb(51,36,169)'],
              ['#F5cF0D', '#fa9203'],
              ['#61dbe8', '#0785de'],
              ['#ff9717', '#ff4518'],
            ];
            let index = params.dataIndex;
            if (params.dataIndex >= colorList.length) {
              index = params.dataIndex - colorList.length;
            }
            return new echarts.graphic.LinearGradient(0, 0, 1, 0, [
              {
                offset: 0,
                color: colorList[index][0],
              },
              {
                offset: 1,
                color: colorList[index][1],
              },
            ]);
          },
        },
      },
      label: {
        show: true,
        position: 'right',
        valueAnimation: true,
      },
    },
  ],
};
修改后的样子
修改代码
折线图柱状图混合(折柱混合)
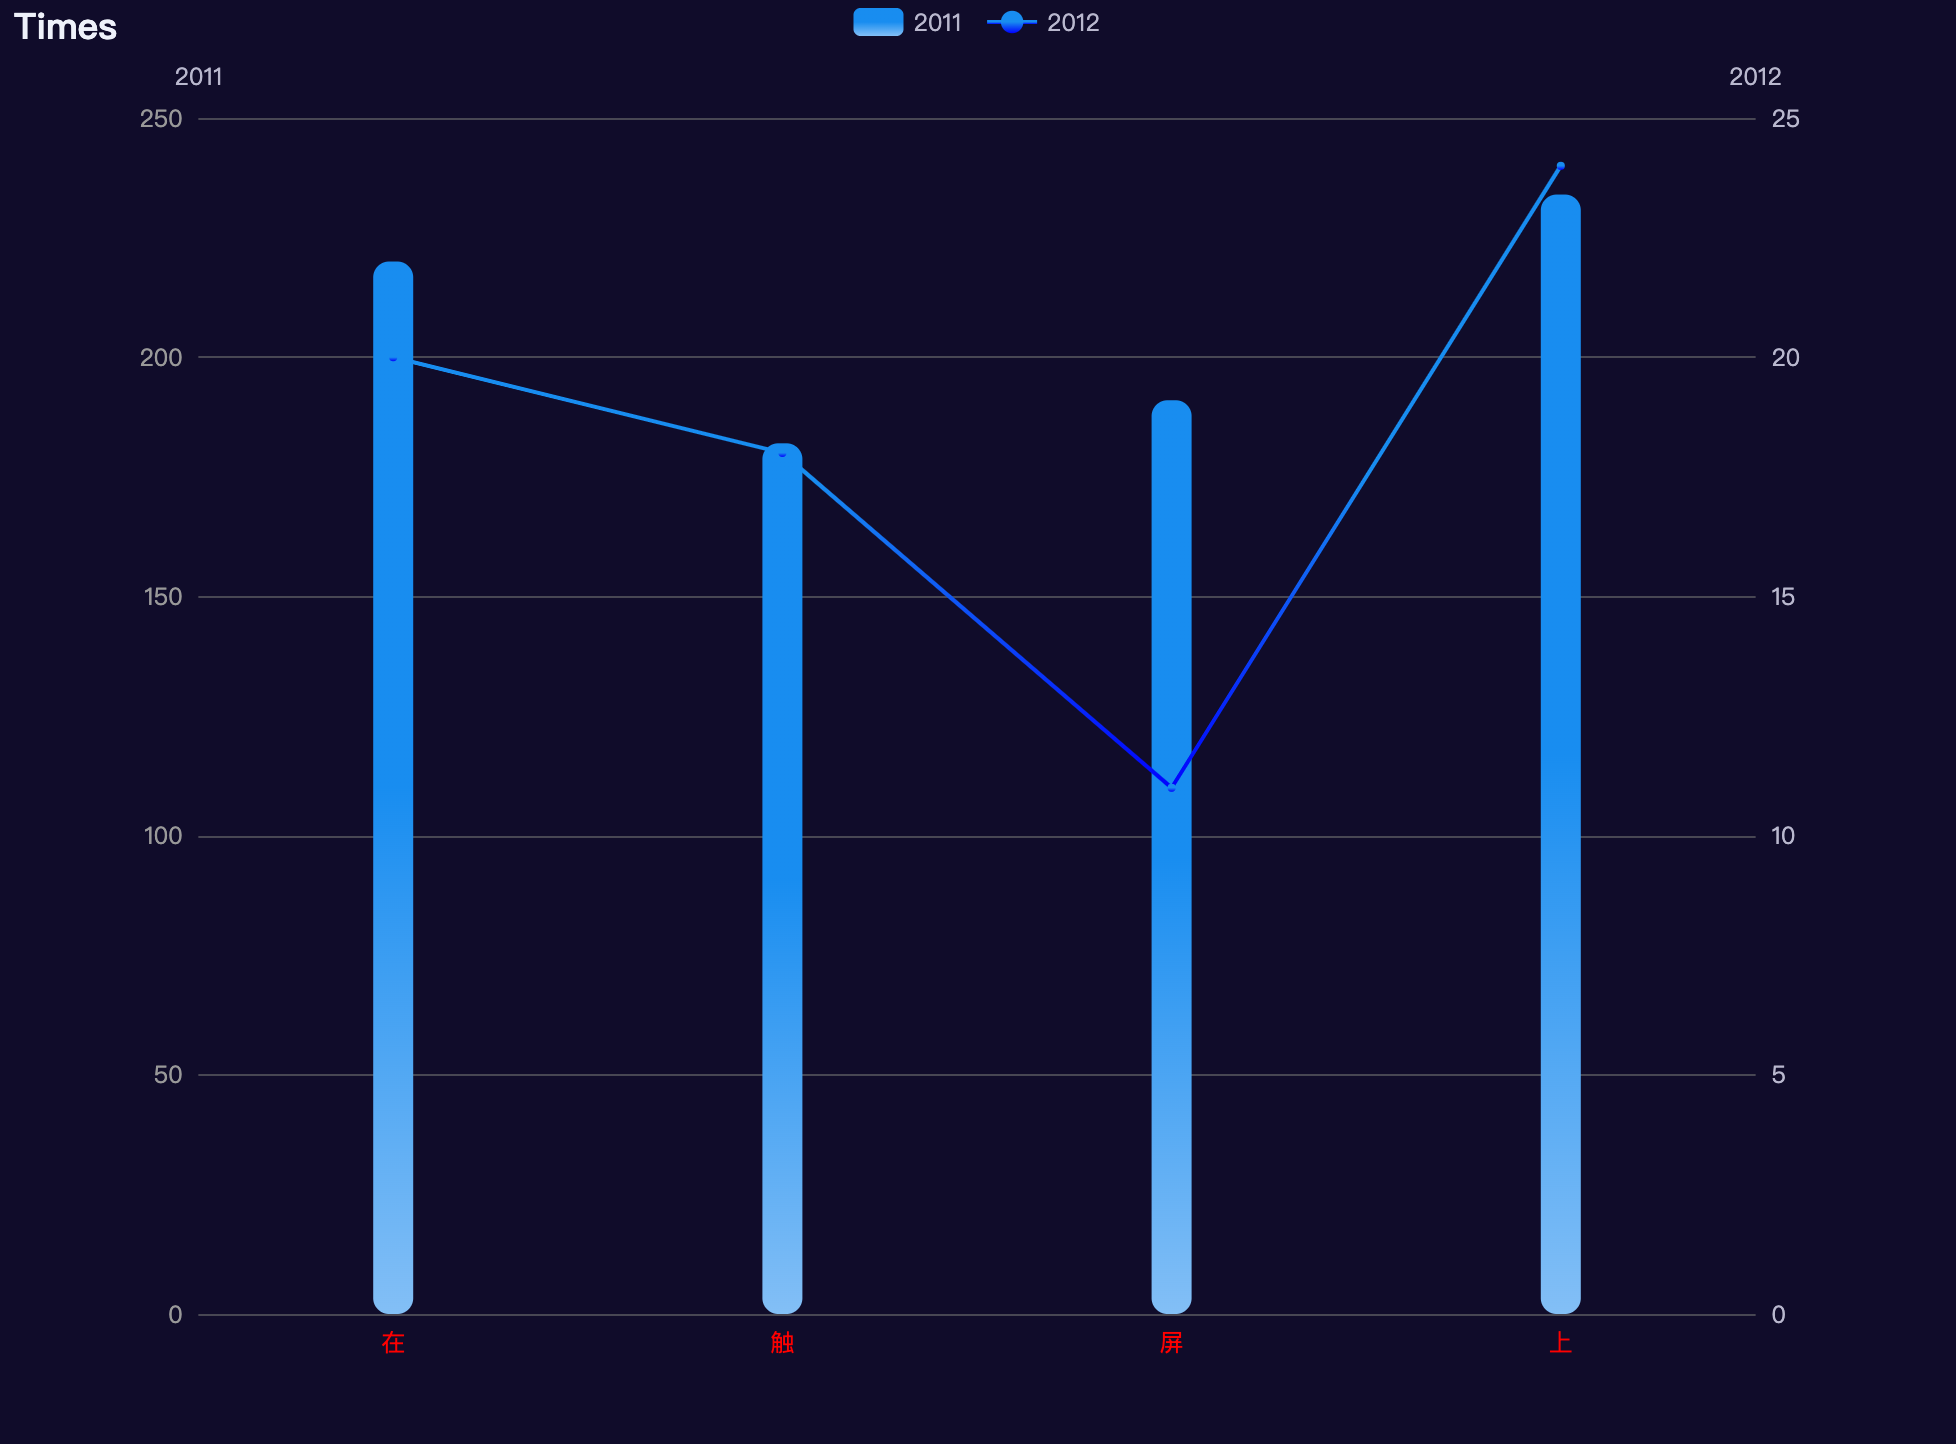
代码配置
// prettier-ignore
let dataAxis = [ '在', '触', '屏', '上'];
// prettier-ignore
let data = [220, 182, 191, 234,];
let yMax = 500;
let dataShadow = [];
for (let i = 0; i < data.length; i++) {
  dataShadow.push(yMax);
}
option = {
  title: {
    text: 'Times',
  },
  xAxis: {
    data: dataAxis,
    axisLabel: {
      // inside: true,
      color: 'red'
    },
    axisTick: {
      show: false
    },
    axisLine: {
      show: false
    },
    z: 10
  },
  yAxis: [
    {
      type: 'value',
      name: '2011',
      min: 0,
      max: 250,
    //     axisLine: {
    //   show: false
    // },
    // axisTick: {
    //   show: false
    // },
    axisLabel: {
      color: '#999'
    },
      interval: 50,

    },
    {
      type: 'value',
      name: '2012',
      min: 0,
      max: 25,
      interval: 5,
      axisLabel: {
        formatter: '{value}'
      }
    }
  ],

  legend: {
    show: true
  },
  dataZoom: [
    {
      type: 'inside'
    }
  ],
  series: [

    {
       name: '2011',
      type: 'bar',
      barWidth:20,
      showBackground: false,
      itemStyle: {
         barBorderRadius: 8,

        color: new echarts.graphic.LinearGradient(0, 1, 0, 0, [
          { offset: 0, color: '#83bff6' },
          { offset: 0.5, color: '#188df0' },
          { offset: 1, color: '#188df0' }
        ])
      },
      data: data
    },{
       name: '2012',
      type: 'line',
      barWidth:20,
      barGap:'150%',//柱图间距
      showBackground: false,
      yAxisIndex: 1,
      itemStyle: {
         barBorderRadius: 8,

        color: new echarts.graphic.LinearGradient(0, 1, 0, 0, [
          { offset: 0, color: 'blue' },
          { offset: 0.5, color: '#188df0' },
          { offset: 1, color: '#188df0' }
        ])
      },
      data: [20, 18, 11, 24,]
    },

  ]
};
// Enable data zoom when user click bar.
const zoomSize = 6;
待继续补充
今天就写到这里啦~
- 小伙伴们,( ̄ω ̄( ̄ω ̄〃 ( ̄ω ̄〃)ゝ我们明天再见啦~~
- 大家要天天开心哦
欢迎大家指出文章需要改正之处~
学无止境,合作共赢
